Assessments & Reviews
-
Cloud Licensing Plan
-
Observability Assessment
-
Resilience Assessment
-
Security Assessment
-
Well-Architected Review

Managed Services

Security

Modern Applications

Strategic Consulting
-
AWS Consulting
-
Splunk Consulting
-
Cloudflare Consulting
-
Grafana Labs Consulting
-
Oracle Consulting

AWS Solutions
-
Cloud Licensing Plan
-
Cloud Migration & Optimization
-
Disaster Recovery
-
Enterprise Content Management
-
Experts on Call
-
Funding Programs
-
Intelligent Document Processing
-
Managed Services
-
Platform Support Services
-
Splunk on AWS
Splunk Solutions

Cloudflare Solutions

Grafana Labs Solutions
Oracle Solutions

Cyber Risk & Remediation Planning
Mitigate Digital Risk
Enterprise Security
Cybersecurity Solutions

Managed Detection & Response
Cybersecurity Toolbox
CMMC
Compliance & Strategy

Sectors We Serve
-
Higher Education & K-12
Experiential Learning Labs
-
State & Local Government
Staff Upskilling
-
Federal
Outsourcing & SOC Analyst Resources

Public Sector Services
-
Cloud Adoption
Modernize Digital Infrastructures
-
Security for Government Agencies
Protect Against Advanced Threats
-
Workforce Development
Staffing & Placement
Featured Story

New Jersey Institute of Technology Prioritizes Experiential Cybersecurity Learning
Read More

Competencies & Specialties
Find Critical Talent
Federal & Cleared Services
Hire Vetted Candidates

RPO Solutions
Custom Recruiting Support

Staff Augmentation
Hiring Aligned to Your Needs
Featured Case Study

Rapid Fulfillment of Engineering Positions through RPO Partnership
Read the Story

Blogs
Industry News & Technical Tips
Case Studies
Customer Success Stories

Datasheets
Project Capabilities

Newsroom
See What’s New

Webinars & Videos
Learn, Ask, Discover More

White Papers & Guides
In-Depth Solution Handbooks

Awards & Contracting Vehicles
Review Our Credentials
Featured Story
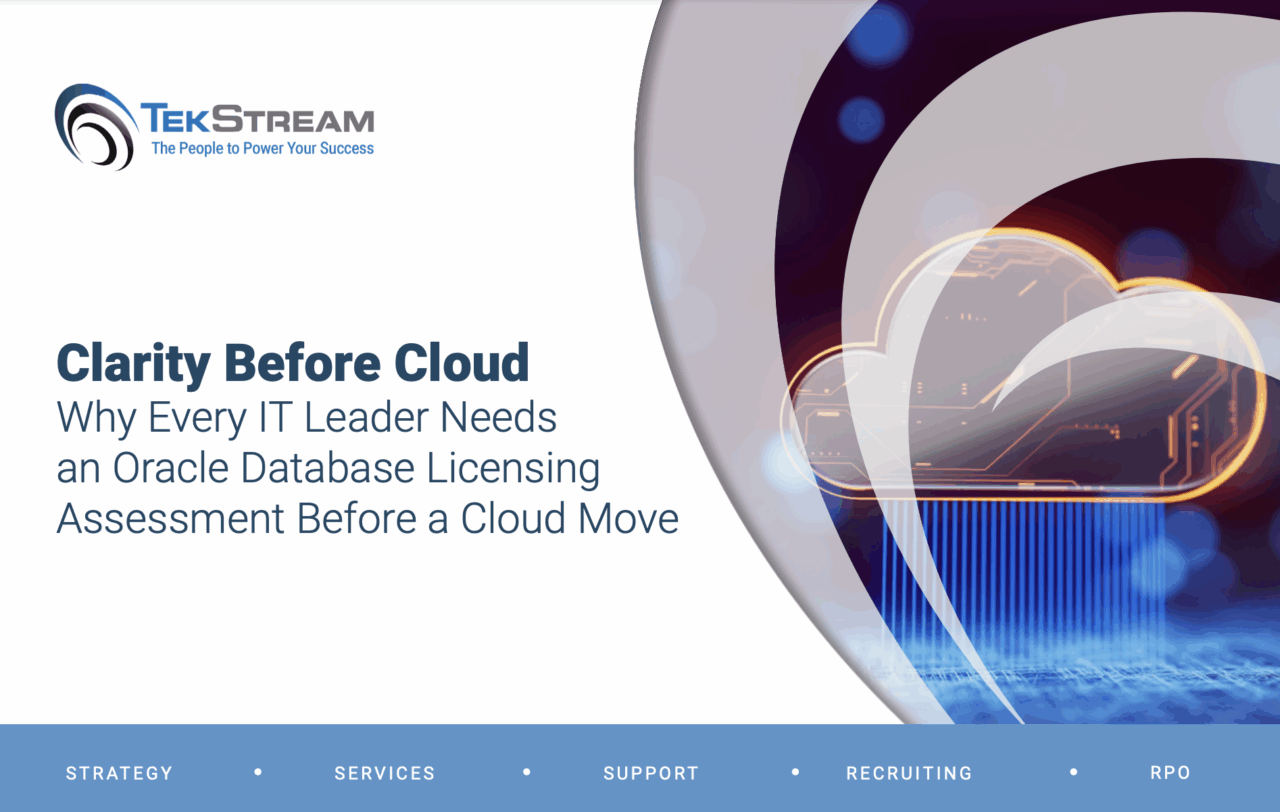
Clarity Before Cloud: Why Every IT Leader Needs an Oracle Database Licensing Assessment Before a Cloud Move
Read the Story

Meet the Team
Leadership & Culture
Why TekStream
What Sets Us Apart

Careers
Careers, Benefits & Job Listings

Referrals
Let’s Grow Together
Newsroom
TekStream Highlights

Contact Us
844-TEK-STRM
Category: Blog

Getting Rid of Unwanted Data with SEDCMD’s in Splunk

Splunk Disaster Recovery Architecture

GOV. EDWARDS, PRESIDENT TATE OPEN DOORS TO NEW LSU CYBERSECURITY OPERATIONS CENTER, PROTECTION MODEL FOR LOUISIANA

Time Range for Searching Splunk Events

Guidance for Headless Content Management Design: Key Design Strategies for Headless Implementations of Oracle Content Management Cloud

- Blog
- Security Bulletin
- Splunk
TekStream Security Bulletin: Akira on Cisco Adaptive Security Appliance (ASA) VPN

How to Avoid Skipped Searches in Splunk Cloud

A Beginner’s Guide to Splunk App/User Context Configuration Files
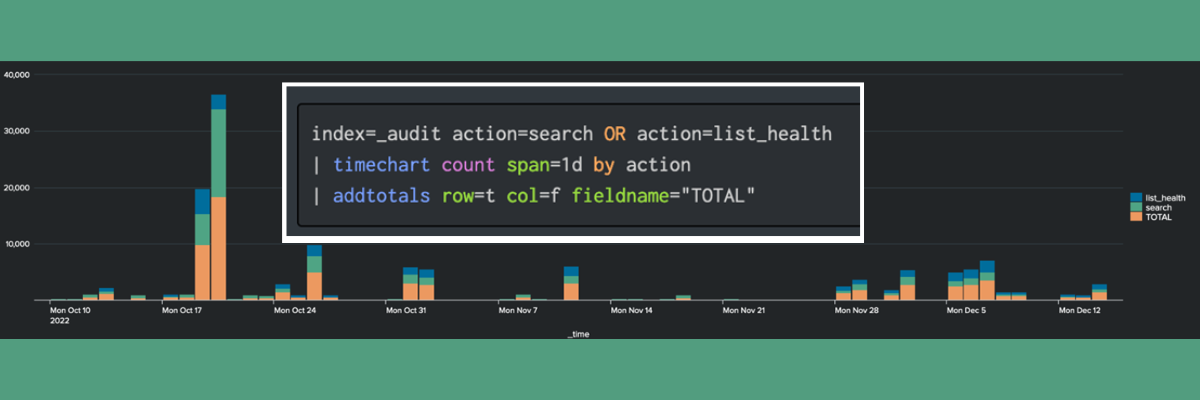
Creating Chart Overlays and Annotations (Flags) in a TimeChart

We serve cookies on this site to analyze traffic, remember your preferences, and optimize your experience.