


New Feature in Splunk to Monitor Environment Health
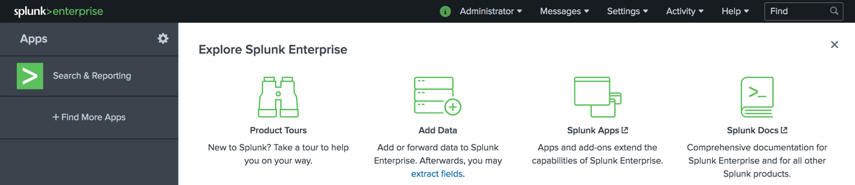
A new feature introduced in Splunk 7.2 is the Splunkd Health Status Report. Monitoring Splunk’s status by checking if Splunkd is running may tell you if Splunk is running, but it won’t tell you if there’s a problem developing while Splunk is running. In the latest version of Splunk, you’ll only need to look next to your name to figure out how Splunk is doing.
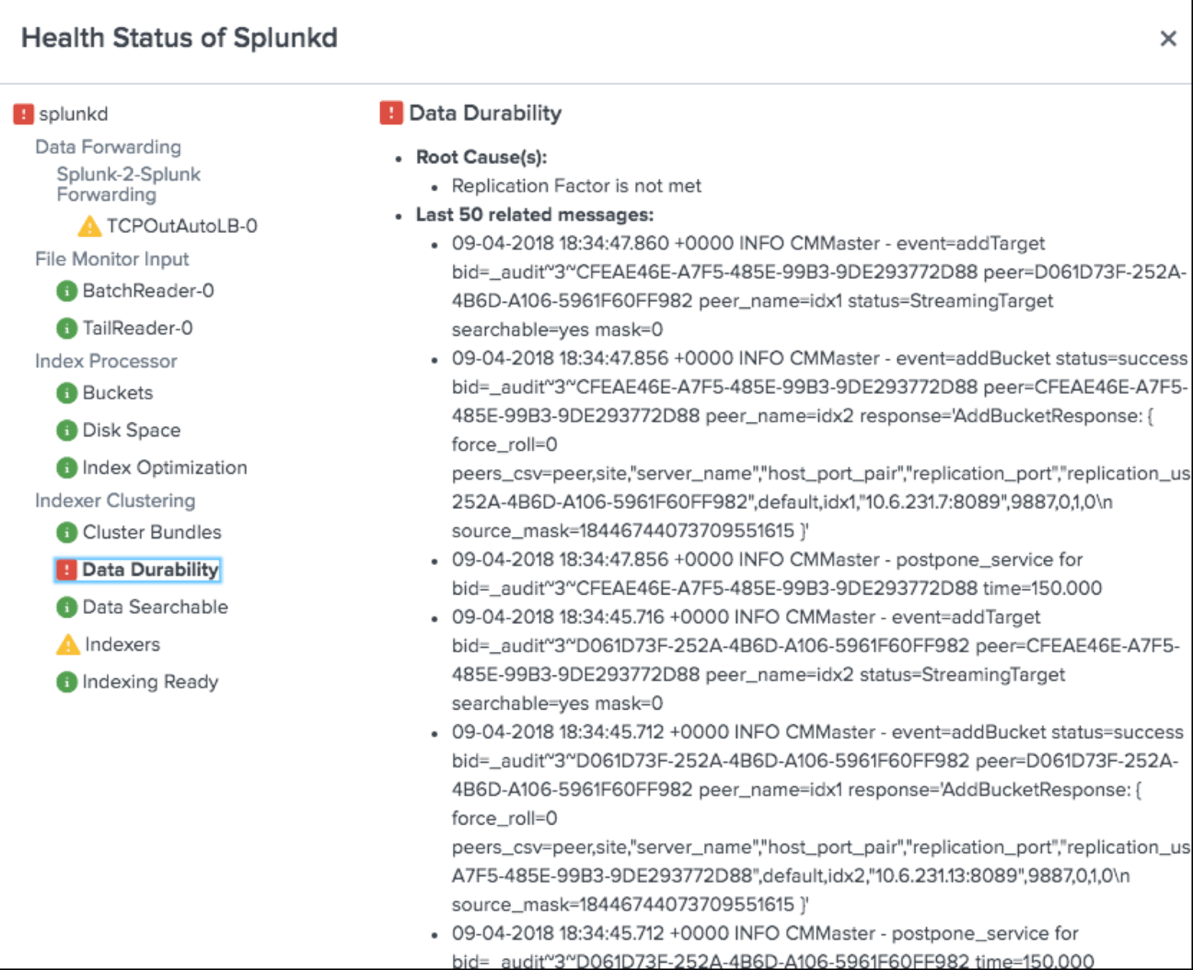
Once you click on the icon, a screen will pop up with the health status of Splunk.
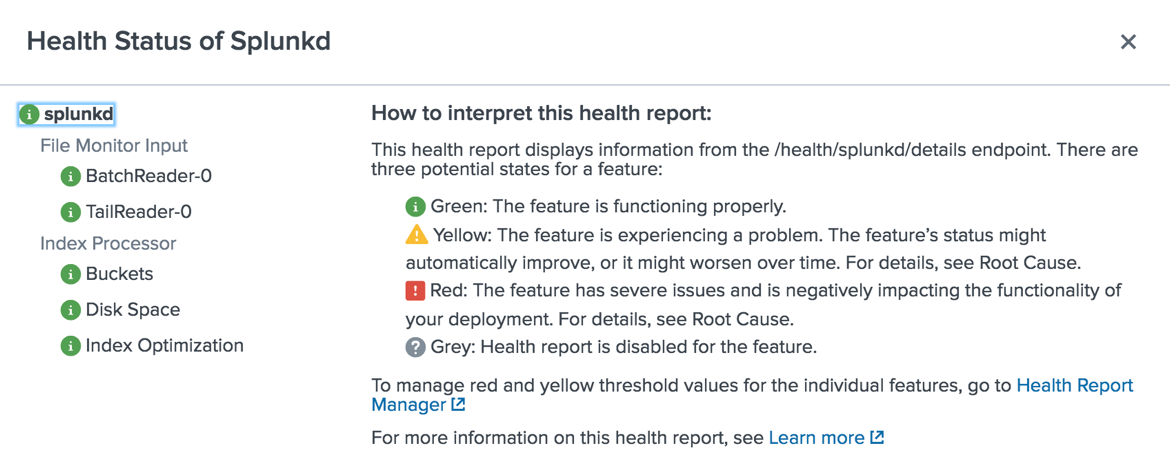
The status tree is broken down into 4 areas, Splunkd, Feature Categories, Features, and Indicators.
| Splunkd | The overall status of Splunkd is based on the least healthy component in the tree. The status is for the specific host only. |
| Feature Categories | This is the second stage, and represents a logical grouping of features. Feature categories won’t have a status. |
| Feature | Each feature status is based on one or more indicators, with the least healthy indicator status as the status for the particular feature. |
| Indicators | Indicators are the lowest levels of measurable health status that are tracked by each feature. The colors for status change as health for each feature changes. |
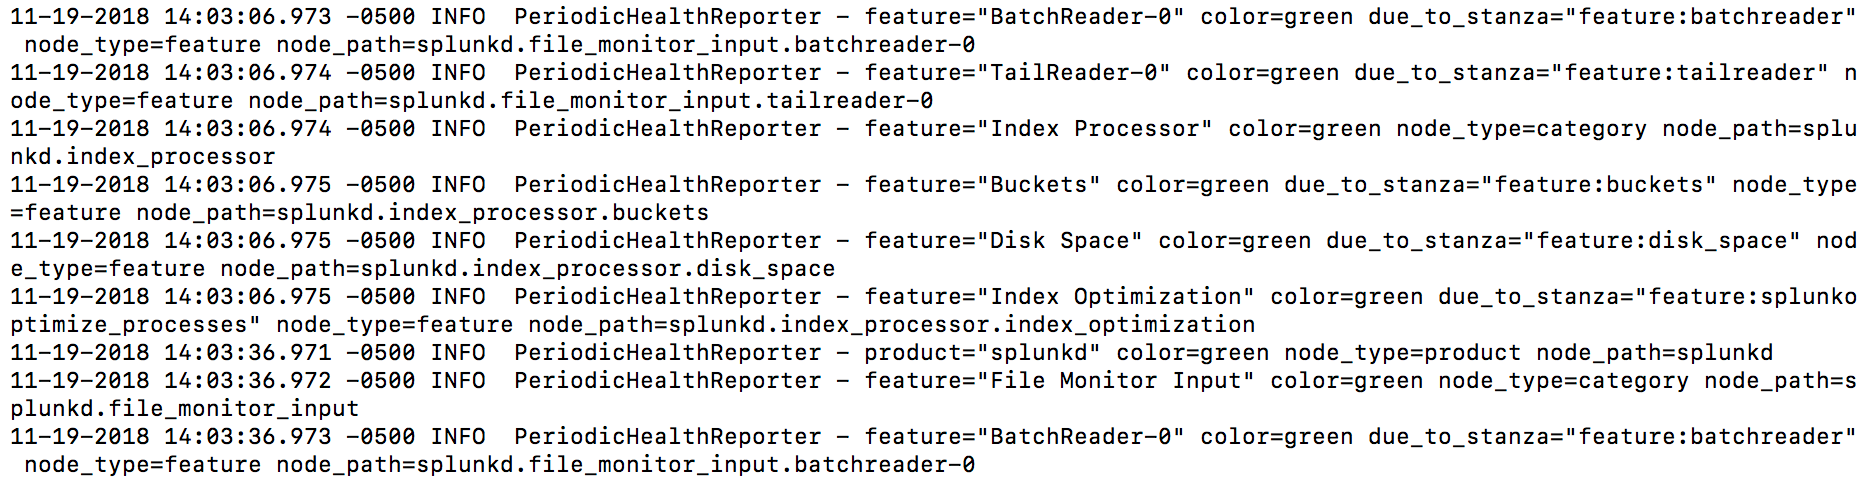
In the event more details are required, the health report also generates a log, and can be found at: SPLUNK_HOME/splunk/var/log/splunk/health.log
Here’s a sample of the log:
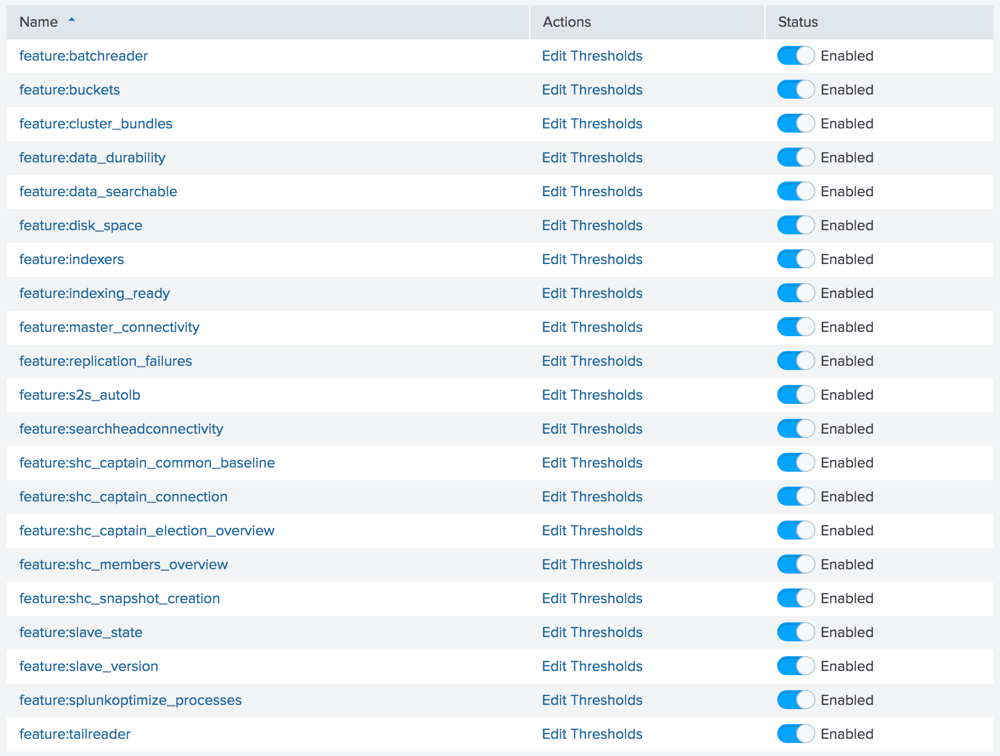
Changing notification settings can be found in the Settings menu. From Settings, select Health report manager.
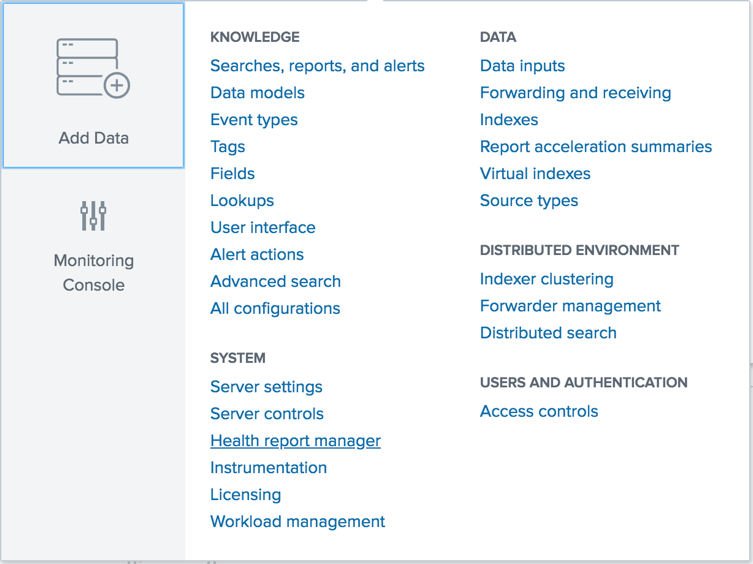
From there, each feature can be enabled or disabled, and the thresholds set.
As with other functions and features in Splunk, settings for health monitoring can be changed through a conf file. This is located in $SPLUNK_HOME/etc/system/local/health.conf. Alerting thresholds, intervals, and seriousness can all be defined in the configuration file. A tremendous benefit to being able to configure the health monitoring is the ability to add alerts. When an alert fires, it can send a notification via email or PagerDuty. To enable this feature, simply add the following stanza to health.conf:
[alert_action:email]
disabled = 0
action.to = <recipient@example.com>
action.cc = <recipient_2@example.com>
action.bcc = <other_recipients@example.com>
And finally, the health monitoring feature can be used by other monitoring tools. Using a curl command, other tools can help to better monitor your Splunk environment. The curl command is:
curl -k -u admin:pass https://<host>:8089/services/server/health/splunkd
When things go wrong, it may be difficult to determine where to begin troubleshooting. The monitoring tool helps by proving a root cause, and the last 50 related messages. This will help the admin better asses the problem and remediate it.
Splunk health monitoring is a simple, effective tool to help keep a Splunk environment healthy. Adding features, tuning indicators, adjusting intervals, and setting
alerts are all ways this new tool pre-loaded into Splunk can help ensure Splunk is healthy.
Want to learn more about Splunkd Health Status Report? Contact us today!
[pardot-form id=”16923″ title=”Blog – Pete Chen – New Feature in Splunk to Monitor Environment Health”]