


Enhanced Troubleshooting for Blocked Queues
By: Eric Howell | Splunk Consultant
Overview
Splunk’s method of ingesting and storing data follows a specific set of actions. These actions (e.g. event parsing, timestamping, indexing, etc) are separated logically and performed in different pipelines. Please refer to the below, Splunk-provided breakdown in which queue/pipeline these activities are performed.
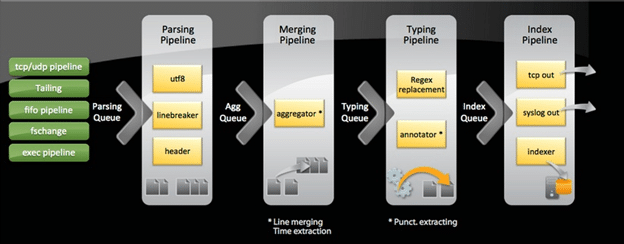
As you can see, actual ingestion of data into Splunk has many different processes that are followed before the data finally finds its resting place within a bucket. At each stage, a configuration file (props.conf or transforms.conf for the majority of activities) will dictate what is done, often tied to provided regex within the .conf file or other attributes within the file. Since there is no one-size-fits-all method to ingesting that expansive myriad of data types and formats that can be brought into Splunk, to say nothing of formatting issues that can happen to a log or data stream, custom ingestion settings are frequently configured to ensure proper data integrity and consistency.
This also creates a number of places where a configuration or attribute can create conflict (e.g. greedy regex, improper implementation of the “Big 8” props.conf configurations, etc) and cause Splunk to spend more time than absolutely necessary to parse, type, aggregate, or index quickly. These issues may go unnoticed for a long period of time until a larger volume data stream is ingested or during a period of greater activity on the servers providing their logs to Splunk, at which point you can experience significant slow-down in your ingestion process. This can lead to events becoming searchable seconds, minutes, hours (or worse) later than the actual inciting time frame. This could have heavy impact during an outage when teams are attempting to triage or troubleshoot and return an environment to full function.
Quickly and effectively identifying which queues are being blocked, or causing slow down, is relatively straightforward, but there are configurations that can be implemented to enrich your internal logs to help you pinpoint specific sourcetypes that are your pain points.
Initial Troubleshooting
You have determined that events are arriving later than expected, and you suspect that queues are being blocked. The next step would be to determine which specific queues are being blocked. The search provided below will provide insight on which queues are experiencing blocks:
index=_internal source=$SPLUNK_HOME/var/log/splunk/metrics.log blocked=true
(replace $SPLUNK_HOME with wherever your Splunk install is located on your server)
Your results will provide something like this:

In this example, the typing queue is the blocked queue in question. Now, you’ll be wondering, what exactly am I to do with that? Without additional configurations, the metrics.log is missing some of the robust functionality that will help you pinpoint the specific sourcetype causing the block, but you can reference this information against your knowledge of the ingestion pipeline (the image included at the top of this document) to troubleshoot settings that could be causing slowness during this process.
It is important to remember the order of queues in the pipeline, as the the queues later in the pipeline experiencing blocks will cause upstream queues to fill up, as well.
Additionally, the Monitoring Console can provide visualizations to help identify blocked queues by navigating to Indexing- > Performance -> Indexing Performance : Instance (or Advanced).
Expanding Functionality
You can enrich your visualizations by making a change to limits.conf on your indexers and forwarders. This will provide CPU time information for the RegexProcessor process in metrics.log for host, source, sourcetype, and index.
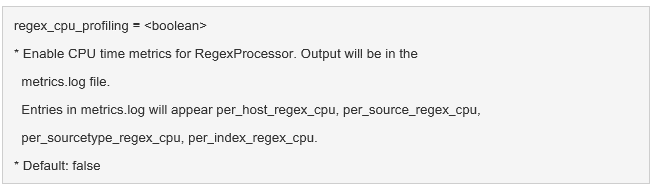
This configuration change needs to be made under the [default] stanza. Implemented correctly, the above configuration will look something like this:
[default]
regex_cpu_profiling = true
With this change configured, and your metrics.log providing more robust information, several additional panels in the Monitoring Console will populate with data. These are found here:
Indexing- > Performance -> Indexing Performance : Advanced
With this information, you should be able to identify the specific sourcetype that is causing your queue blockages and troubleshoot the configurations specific to that data so as to resolve your issue.
Want to learn more troubleshooting tips for blocked queues? Contact us today!