


Dynamic Inputs: Make Your Splunk Dashboards More Flexible
By Nate Hufnagel, Splunk Consultant
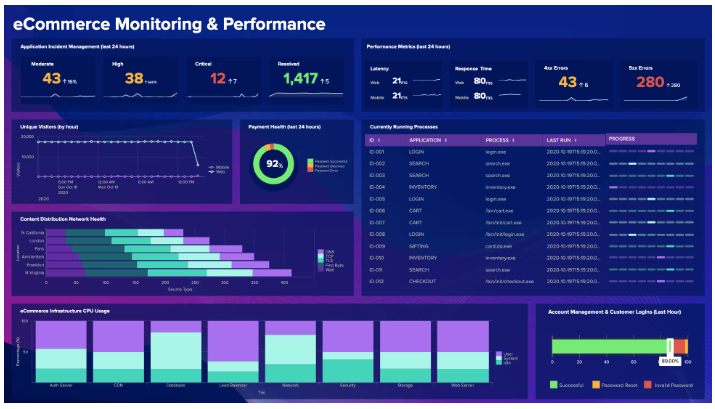
Splunk’s dashboarding capabilities separate it from the rest of the pack. The ability to normalize and visualize data in a way that’s meaningful to all levels of an organization is one of the many reasons it has been widely adopted by businesses in nearly every industry. To achieve this level of versatility, Splunk dashboards come out-of-the-box with powerful features that allow users to create flexible and reusable templates. One of those features is the dynamic input.
Dynamic Inputs: Pros and Cons
Dynamic inputs let you pass one or more values to a panel by using a separate SPL search to populate a list of values. When a user loads a dashboard with dynamic inputs, the populating searches run automatically and return the list of values.
Pros
Dynamic inputs (by definition) are non static, which makes them good for data that changes frequently. That translates to less time reworking inputs to fit incoming data, making your dashboards more flexible.
Cons
It adds another search, and could eat up more resources. This is why we need to make it as performative as possible, and we’ll use tstats to do that.
What is tstats and How is it Used?
Tstats is a generating command that performs statistical queries on indexed fields (as opposed to search time fields). It works similarly to the stats command and even uses the same functions, with one key difference: tstats performs these operations on the tsidx files, as opposed to the raw data in the indexes. This makes tstats much faster than stats: it’s like looking at the table of the contents for information instead of flipping through the whole book.
Implementing tstats Into the Dashboard Inputs
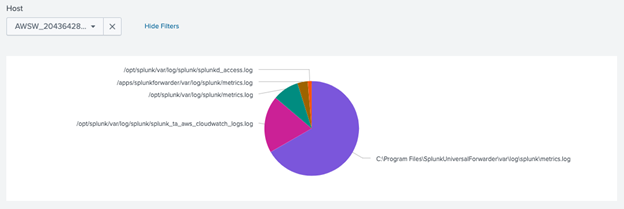
Imagine a Classic dashboard panel showing the top sources by host for a given index. Perhaps this is shown through a piechart visualization. If the list of possible hosts changes frequently, or are too numerous to type by hand, a dynamic input token might be the right tool for the job.
In the dashboard while in Edit mode, select “Add Input” and choose the appropriate input type for your use case. In this example, the Dropdown option will do nicely. These are the important settings and their values:
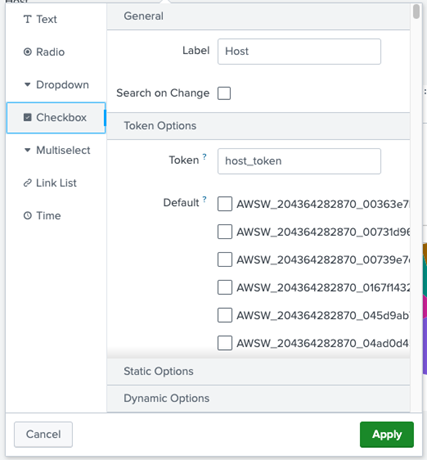
- Under “General” – set the appropriate label and make sure “Search on Change” is selected.
- Under “Token Options” – give the “Token” field the name of the token to use for this input.
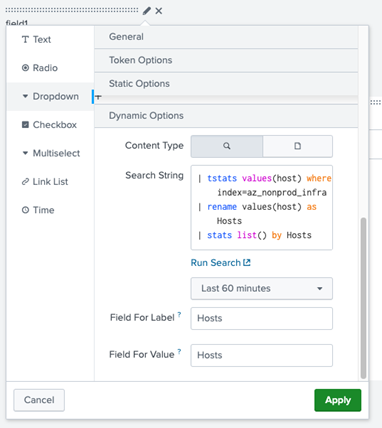
- Under “Dynamic Options” – the “Search String” text box is where you’ll put the search that dynamically returns the values. This is where the tstats search will go. Two things to consider: make sure the search returns a list of values, and be sure to set the time range appropriately for your use case. With tstats you can look over longer time ranges without drastically impacting how long the search runs. Set the values for “Field for Label” and “Field for Value”, which can both be the name of the output field (in most cases). Below is a simple example:
| tstats values(host) where index=<your_index_name>
| rename values(host) as Hosts
| stats list() by Hosts
Once finished, click “Apply”. Double check that your search is returning the correct results and each host is selectable in the dropdown. Finally, add the input token you just created to the appropriate search(es).

That’s it! You can add multiple dynamic inputs to your dashboard by repeating these steps, or pass multiple values through a single token by making a few changes:
- Instead of using the Dropdown input, select “Checkbox” or “Multiselect”
2. Adjust the SPL in the relevant panels to accept multiple values:

My guess is that this will demonstrate that Splunk really does stand out from the pack. With the ability to normalize and visualize your data, you’ll provide actionable insights and put your company on the path to success using Splunk. Fill out the form below if you’d like to ask more. Happy Splunking!