




















Why Your Splunk Environment Is Slow (And How to Fix It in 30 Minutes)
By Chris Swanson, Sr. Splunk Consultant
Do your users complain about Splunk performance or constantly ask “why is Splunk so slow?” Are your search heads flagging search delays or skipped searches? In a security environment, poor Splunk performance is not just a user experience issue. Delayed or skipped searches can mean delayed detections, missed notables, and blind spots in your monitoring coverage. In this article I’ll dive into four common issues that can cause Splunk performance to degrade and some quick fixes we can implement to reduce or resolve them.
At its core, Splunk performance issues are usually caused by resource contention. Too many searches are competing for limited CPU, memory, and I/O across your search heads and indexers.
Four common culprits drive this:
- Scheduler delays: Too many searches are scheduled at the same time, so they queue up instead of running immediately
- Skipped searches: When delays get too severe, Splunk starts skipping searches entirely
- Data model acceleration (DMA) overload: Acceleration jobs consume resources and compete with real-time searches
- Workload management not configured: All searches are treated equally, so low-value queries compete with critical alerts
Individually, these issues are manageable. But together they can create a feedback loop that degrades performance across your entire environment.
If you’ve worked in Splunk long enough, you’ve probably seen some of these:
- Monitoring Console shows recurring scheduler delays or skipped searches
- ES notables show up minutes late (or not at all)
- Dashboards take 10–30 seconds to load
- Users complain that “Splunk is slow,” especially during peak hours
- Gaps in reports where data should exist
- _internal logs filled with scheduler warnings
Worse than what you see can be what you don’t see- you think your detections are working but they’re silently failing due to skipped searches.
Here’s how to triage and improve performance quickly:
Scheduler delays and skipped searches
Start by visiting the Cloud Monitoring Console > Search > Skipped Scheduled Searches. If skipped searches exceed 10–15%, you have a problem. Identify problematic searches by checking Splunk’s internal logs:
index=_internal sourcetype=scheduler status=skipped

| stats count by savedsearch_name

| sort - count
Skipped searches are a red flag as they represent lost data or missed detections. Identify which searches are skipped and prioritize fixing critical ones (alerts, correlation searches). Often the easiest fix for skipped searches is to stagger the cron schedules controlling when scheduled searches run. It is common for scheduled searches to clump around predictable times, such as the top of the hour, half past the hour, or 15- and 45-minute marks. This is not just a human habit; many searches that ship with Splunk add-ons and even Splunk Enterprise Security are scheduled this way by default. When too many searches are scheduled to kick off at the same time, resource contention can occur, so reviewing and staggering these default schedules can have a meaningful impact. A helpful search to visualize the spread of searches across the hour is the following:
| rest /services/saved/searches splunk_server=local

| search is_scheduled=1 disabled=0

| rename cron_schedule as cron

| eval minute_field=mvindex(split(cron," "),0)


| eval minute=case(

    minute_field="*", mvrange(0,60),

    match(minute_field,"^\*/\d+$"), mvrange(0,60,tonumber(replace(minute_field,"^\*/",""))),

    match(minute_field,"^\d+(,\d+)*$"), split(minute_field,","),

    match(minute_field,"^\d+\-\d+/\d+$"),

        mvrange(

            tonumber(mvindex(split(replace(minute_field,"/.*$",""),"-"),0)),

            tonumber(mvindex(split(replace(minute_field,"/.*$",""),"-"),1))+1,

            tonumber(mvindex(split(minute_field,"/"),1))))


| mvexpand minute

| eval minute=tonumber(minute)

| stats count as scheduled_searches by minute

| sort minute
This SPL expands common cron minute patterns into individual minute buckets and returns an easy-to-understand visualization such as this:
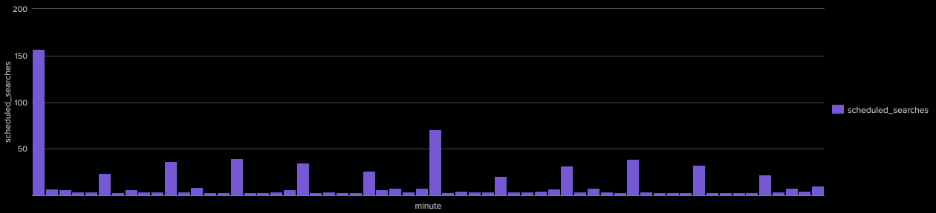
An example of scheduled searches heavily concentrated at the top of the hour, half past the hour, and at five-minute increments.
Identify times that have an above average number of searches running and adjust the cron schedules of those searches to run at off-peak times instead. For example, instead of running every five minutes at */5 * * * *, consider spreading searches across offsets such as 1-59/5, 2-59/5, or 3-59/5 so they do not all start at the same time. Simply staggering search schedules can dramatically reduce scheduler contention without adding hardware.
Splunk also provides an “allow_skew” setting that can offset the actual start time of scheduled searches by a random amount, helping distribute searches that would otherwise all start at the same second. This can reduce resource spikes and scheduler contention, but it should be viewed as a supplement to good scheduling hygiene rather than a replacement for reviewing and staggering heavily clustered cron schedules.
Data Model Acceleration
Many Splunk admins know that data model acceleration (DMA) is important for your searches and reports to get faster results from large datasets. Not as many know the trade-offs involved or best practices recommended by Splunk. Paradoxically, enabling data model acceleration might increase performance issues in your environment (if it is not configured correctly.) This is because for each data model that is accelerated, Splunk needs to schedule a new recurring search to collect and summarize the events included in that data model. To this end, the first best practice regarding DMA is to ensure that only the data models you actually need are accelerated; if you won’t be frequently searching the dataset (either by detection, scheduled search, or report) then disable acceleration for it. Next, for the data models that you do accelerate, set each cim_<datamodel>_indexes macro to only the indexes with relevant data. This limits the DMA summarization search to a subset of indexes, greatly improving its efficiency. Use Splunk recommended values for the backfill (4-12 hours) and summary range (3 months) unless you have an explicit reason otherwise. Increasing either of these will increase the resource consumption of the DMA summarization search. DMA is great for improving search speed, but it can also be one of the more resource-intensive aspects of Splunk, so you want to make sure you are doing it correctly.
Workload management
Splunk Workload Management controls how system resources like CPU are distributed across different types of searches. It allows you to prioritize critical workloads such as alerts and detection searches, so they run reliably even when the system is under heavy load. By separating and limiting lower-priority activity like ad hoc searches, workload management helps prevent resource contention and improves overall performance stability.
To configure workload management, go to Settings > System > Workload Management > Workload Rules. A good start is to create one rudimentary but crucial rule: critical scheduled searches, such as alerts and correlation searches, get placed in a higher-priority workload pool. This ensures that your most important searches are given the lion’s share of system resources. Workload Management allows you to get even more granular and set different priorities for certain users, roles, apps, and more but that is beyond the scope of this post. For more information on advanced workload settings, see Splunk’s Workload Management documentation.
Conclusion
Now you have the background knowledge to start troubleshooting a slow or underperforming Splunk environment in 30 minutes or less. Follow the checklist below to inspect each common culprit and verify that best practices are in place:
30-Minute Splunk Performance Health Check
- Review Monitoring Console scheduler skipped search metrics
- Identify delayed or skipped searches
- Check for cron schedule clustering
- Enable “allow_skew” parameter for searches
- Review accelerated data model configurations
- Confirm Workload Management pools are configured appropriately
In many environments, addressing just one or two of these areas can significantly improve performance without requiring additional hardware or infrastructure changes. More importantly, it can improve the reliability of your detections, reports, and dashboards. Splunk performance tuning is not just about making searches faster but making sure the platform remains trustworthy when your users and security teams need it most.
Is your Splunk environment performing the way it should? TekStream’s Splunk experts can help you identify performance bottlenecks, optimize search efficiency, and improve the reliability of your security operations. Contact our team to schedule a Splunk performance assessment.
About the Author
Chris has over 11 years of experience in the Information Technology field, with 5 years of experience in Cybersecurity and a specific focus on Splunk. He has worked with Splunkcloud as well as Splunk Enterprise on-prem. He has strong knowledge of configuring, deploying, and tuning detections as well as setting up Splunk Enterprise Security. He has experience with integrating many security tools with Splunk and normalizing that data for efficient querying. He holds the Splunk Certified Architect certification and is currently in training to complete the Splunk Core Certified Consultant certification.