


The Hidden Cost of Observability: Why Your Datadog Bill Is Out of Control (And What to Do About It)
By Brad Bell, Grafana Technical Lead
There’s a conversation happening in conference rooms across enterprise IT right now, and it goes something like this:
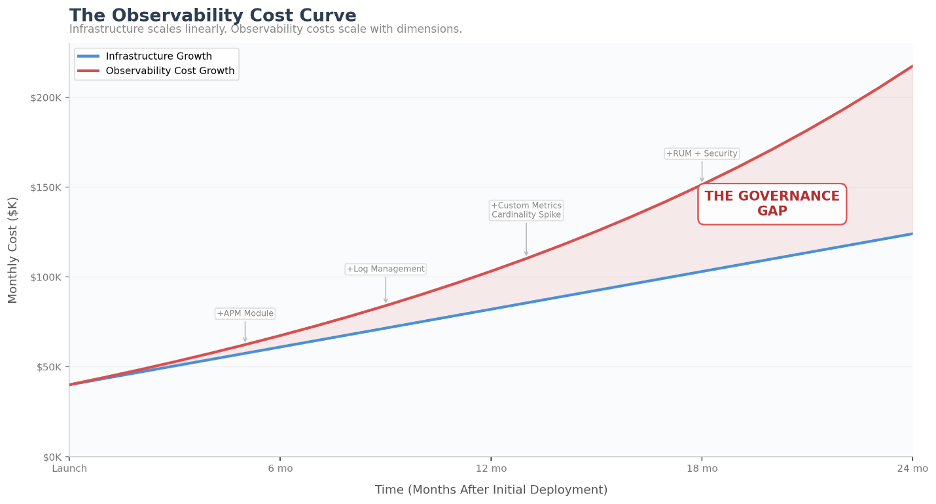
A VP of Engineering pulls up the annual cloud spend review. Infrastructure costs are trending where Finance expected—up a bit, but manageable. Then they look at observability. The Datadog line item was $80,000 a month eighteen months ago. Today it’s $180,000. There was no single decision to double the spend. No one approved it. It just grew—quietly, steadily, month over month—as teams added modules, onboarded new services, and nobody questioned whether dev environments needed the same telemetry depth as production.
That’s the pattern. Observability cost shock rarely arrives as a sudden spike. It’s the slow accumulation of reasonable decisions that compound into an unreasonable bill. According to the Grafana Labs 2025 Observability Survey, 74% of respondents say cost is a top priority when selecting observability tools—a signal that billing predictability has become a boardroom concern, not just an engineering one.
Bottom line: In modern stacks, observability costs don’t scale linearly with infrastructure—they scale with dimensions: hosts, containers, tags, retention, indexing, and modules. If you don’t govern those dimensions, your bill will govern you.
How Datadog’s Pricing Actually Works
Datadog is a genuinely good product. The platform’s breadth, the UX, the integration ecosystem—there’s a reason it’s the market leader with a roughly $40 billion market capitalization. Nobody made a mistake by choosing it.
The challenge isn’t the product. It’s that the pricing model interacts with modern infrastructure in ways that are difficult to predict and even harder to govern. Datadog’s billing is multi-dimensional and usage-based: infrastructure monitoring, APM, log management, custom metrics, synthetics, RUM, database monitoring, and security each carry their own billing metric. List pricing for infrastructure monitoring starts at $15 per host per month on the Pro plan and $23 for Enterprise. APM adds $31 per host. Log management charges by ingestion volume ($0.10 per ingested GB) with separate indexing costs ($1.70 per million indexed events). Custom metrics carry overage charges of $5 per 100 metrics per month above your included allotment, though in practice, organizations running APM often find their custom metrics bundled with APM host pricing.
Then there’s the billing model itself. Datadog measures your host count every hour, discards the top 1% of readings, and bills you at whatever peak remains—what’s known as “high-water mark” billing. Run 200 hosts for a five-day marketing event but normally operate at 50? You’re paying the 200-host rate for the full month. As SigNoz’s analysis puts it, teams end up “making architectural decisions based on monitoring costs rather than application needs.”
None of this means Datadog is the wrong choice. For many organizations, the integrated experience, the speed of deployment, and the breadth of the platform justify the premium. But it does mean that running Datadog without active cost governance is like running AWS without FinOps—you’ll spend more than you should, and the bill will only go in one direction.
It’s Not Just Datadog
Here’s what most vendor-comparison blogs won’t tell you: every major commercial observability platform has pricing mechanics that spiral under the same conditions. The billing units differ, but the outcome is identical—costs that outpace infrastructure growth.
Dynatrace charges by GiB-hours: the memory footprint of each host multiplied by the time it’s monitored. Full-stack monitoring lists at $0.08 per hour for an 8 GiB host—roughly $58 per month. Scale that to a 16 GiB server running 24/7 and you’re at approximately $115 per month at published rates for full-stack monitoring alone. The platform also requires a minimum annual commitment under its DPS (Dynatrace Platform Subscription) model. Dynatrace’s Davis AI engine is genuinely impressive for automated root cause analysis, but the billing model rewards memory-efficient architectures and punishes large-footprint hosts—which conflicts with how many enterprises actually run.
Splunk Observability Cloud prices by host ($15–$75 per month depending on tier) or by data ingest volume. The end-to-end package lists at $75 per host per month—at 500 hosts, that’s $37,500 monthly before negotiated discounts. And Splunk’s published contract terms include annual price escalators, typically 5–9% depending on contract length, meaning your costs compound even if your environment stays flat. Since the Cisco acquisition, many organizations are reevaluating during their next renewal window.
New Relic simplified to per-user seats plus per-GB data ingest. Practitioners who’ve worked across multiple platforms often praise the simplicity of New Relic’s model: if you want to pay less, send less data. The platform even allows you to discard data at ingestion rather than at the agent, giving teams more direct control. But per-user pricing creates a different tension: every engineer, SRE, and on-call responder who needs access is another seat. Organizations end up restricting access to control costs—which undermines the shared-visibility culture that observability is supposed to enable.
The point isn’t that these are bad products. Every platform on this list earned its position by solving real problems for real engineering teams. The point is that observability cost shock is a structural problem with commercial pricing models, not a failure of any single vendor. Understanding how your specific platform’s billing works is the first step to controlling it.
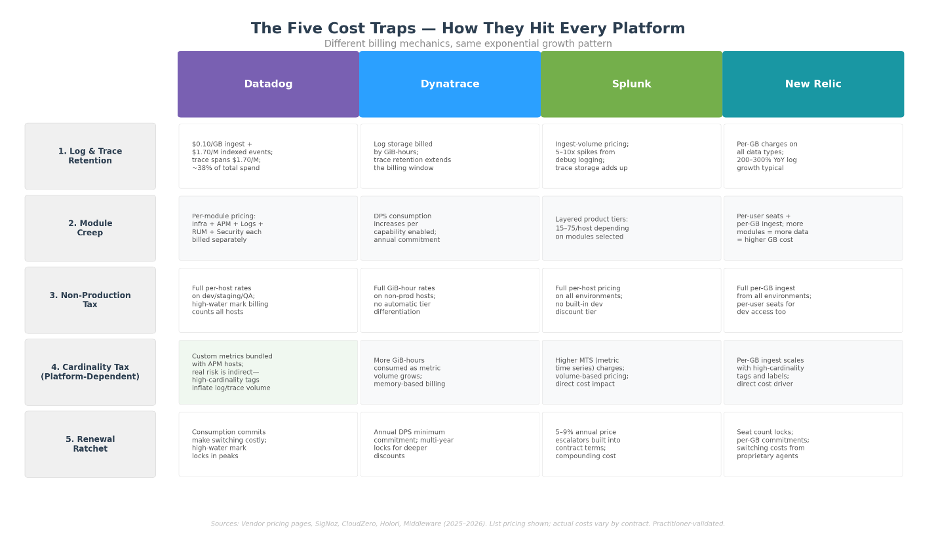
The Five Cost Traps That Hit Every Platform
After working across dozens of enterprise observability environments, the same patterns appear regardless of which logo is on the invoice:
1. The Retention Trap (Logs and Traces)
This is consistently the largest controllable cost driver in commercial observability platforms. Teams default to retaining everything—every log line, every trace—at full resolution because nobody wants to be the person who deleted the data needed during a post-incident investigation. The instinct is understandable. The math is brutal.
Logs and traces follow the same pattern: people have a tendency to want them all, and pushing back on “do you actually need literally every trace?” is a similar battle to the log retention conversation. At Datadog’s log pricing ($0.10/GB ingest plus $1.70 per million indexed events), Splunk’s ingest rates, or New Relic’s per-GB charges, unbounded retention is one of the fastest paths to runaway costs. Data shows log volumes typically grow 200–300% year-over-year in organizations without active management—regardless of platform.
The compounding factor: in many Datadog environments, log costs alone account for 35–40% of total spend, split between ingestion and indexing. When you add trace retention on top—APM hosts, indexed spans ($1.70 per million), and profiled hosts—retention decisions can drive more than half of the entire observability bill.
2. The Module Creep
You start with infrastructure monitoring. APM follows naturally—you need to correlate infrastructure with application performance. Then database monitoring. Then RUM. Then security. Each module adds its own billing dimension. Because the modules integrate well, the expansion feels justified until the renewal arrives and the combined spend is 3x what you originally budgeted. Third-party estimates suggest mid-size companies commonly spend $50,000–$150,000 annually on Datadog alone, with enterprise deployments exceeding $1 million once APM, logs, and RUM are included.
3. The Non-Production Tax
Development, staging, QA, and performance testing environments often run the full monitoring agent with production-grade configuration. These environments generate substantial telemetry that rarely delivers proportional insight. But because monitoring is deployed as part of the infrastructure-as-code pipeline, nobody questions whether dev needs the same observability depth as production. You’re paying full per-host, per-GiB, or per-series rates on environments where basic health checks would suffice.
Organizations that address this aggressively—implementing tagging policies that automatically drop untagged non-production telemetry before it’s retained—often find immediate savings. A straightforward policy: define 5–6 required tags for all telemetry. If non-production data is missing a required tag, don’t retain it. You can still see it in real-time for troubleshooting, but you’re not paying to store data that nobody will ever query. Production gets a different treatment—allow some untagged data through with sampling, because it’s production and the risk calculus is different.
4. The Cardinality Tax (Platform-Dependent)
This one is nuanced, and the impact varies significantly by platform and configuration. On Datadog, custom metrics carry overage charges of $5 per 100 metrics per month—but organizations running APM often find their custom metrics effectively bundled, making cardinality a manageable issue rather than a primary cost driver. The real cardinality risk on Datadog is indirect: high-cardinality tags (user IDs, request IDs, UUIDs) inflate the volume of logs and traces being retained, which feeds back into Trap #1.
On other platforms, cardinality hits differently. Dynatrace charges more GiB-hours as metric volume grows. Splunk charges per metric time series (MTS). New Relic charges per GB of ingest, so every additional time series adds to the bill. The point: audit your tags regardless of platform, but understand that the financial impact of cardinality depends on how your specific vendor meters it.
5. The Renewal Ratchet
Without a credible alternative evaluated, the vendor holds the leverage at renewal. Splunk’s published terms include 5–9% annual escalators. Datadog and Dynatrace use consumption commitments that make switching feel expensive. New Relic locks in seat counts. The mechanism varies, but the result is the same: structural incentives that increase your spend year over year. The most cautionary tale in the space: during Datadog’s Q1 2023 earnings call, analyst calculations revealed a single customer had accumulated approximately $65 million in annual charges. The Pragmatic Engineer newsletter subsequently identified the customer as Coinbase, where the bill reflected 2021 usage during the crypto boom—a case study in what happens when telemetry governance doesn’t keep pace with infrastructure growth.
What You Can Do About It
Cost optimization doesn’t require a platform migration. Some of the highest-impact moves work on whatever you’re running today:
Run a forensic spend analysis. Map consumption patterns by team, service, and environment. Most enterprises discover that 20–30% of their observability spend generates minimal operational value—data being collected, stored, and billed that nobody ever looks at. Datadog, Dynatrace, and Splunk all provide usage dashboards; the data is there. Someone just needs to look at it with cost-optimization intent.

This is the kind of policy a VP can forward to every team lead tomorrow morning. It doesn’t require a platform change—just governance.
Enforce tagging compliance. Define 5–6 required tags for all telemetry (service name, environment, team, application, cost center). Enforce a simple rule: if non-production telemetry is missing a required tag, it doesn’t get retained. Live views still work for real-time troubleshooting, but you’re not paying to store data that can’t be attributed to a team or purpose. Production telemetry gets a lighter touch—sampled retention for untagged data rather than full drop—because the operational risk is different. This single policy creates accountability, improves data quality, and reduces spend simultaneously.
Convert high-volume logs to metrics where possible. Most commercial platforms offer some form of log-derived metrics—Datadog calls it “logs to metrics,” where you translate a raw log message into a numerical value that can power monitors and dashboards. The cost difference is dramatic: a metric derived from a log pattern costs a fraction of indexing the raw log itself. If you’re running Datadog and paying significant indexing costs, audit your top ten indexed log sources. Frequently, a few targeted conversions—turning a verbose log pattern into a count or gauge—can save thousands per month per service without losing the operational signal.
Right-size trace retention. Apply the same discipline to traces that you apply to logs. Not every transaction needs a full distributed trace stored for 15 days. Sample strategically: keep 100% of error traces, sample successful transactions at 10–20%, and set shorter retention windows for non-critical services. The diagnostic value of a trace drops sharply after the first few days; your retention policy should reflect that.
Use renewals as leverage. A documented comparison between your current platform and at least one credible alternative—with actual migration feasibility assessed—changes the negotiation dynamic entirely. You don’t have to switch. You just need the vendor to know you could.
When Optimization Isn’t Enough
Sometimes governance reaches its ceiling. When observability spend crosses the $500K+ annual threshold and the growth is structural—tied to host count, container density, and data volume rather than waste—it’s worth understanding what fundamentally different pricing models look like.
The Grafana ecosystem represents a different economic approach. Self-managed Grafana with Prometheus, Loki, Tempo, and Mimir is fully open source—no licensing cost, though you’re accepting operational overhead for the stack. Grafana Cloud offers a managed option with usage-based pricing by series, volume, and retention that avoids blanket per-host charges, and includes capabilities like Adaptive Metrics that automatically identify and reduce unused time series. Grafana Labs was named a Leader in the 2025 Gartner® Magic Quadrant™ for Observability Platforms for the second consecutive year.
But migration isn’t trivial. Any credible assessment needs to account for the full picture: migration effort, parallel operation costs, team training, the productivity dip during transition, and the three-year total cost of ownership on the new platform versus optimized spend on your current one. “Lift and shift” approaches that carry existing inefficiencies to a new platform miss the point entirely.
The right approach is phased: forensic analysis of current spend, architecture design for the target state, a production-relevant proof of concept with real data, and then a measured transition with clear success criteria. Anything less is just trading one set of problems for another.
The Bigger Picture
The observability cost conversation is really a proxy for a more fundamental question: is your observability platform an asset or a liability?
An asset delivers proportional value as you scale. A liability grows faster than your infrastructure budget and generates anxiety every renewal cycle. That determination has nothing to do with which logo is on the invoice—it has everything to do with whether your organization has the governance, architecture, and telemetry strategy to keep costs aligned with value.
The organizations that navigate this well don’t treat it as a technology decision alone. They treat it as a business decision informed by technology—one that involves Engineering, Finance, and Procurement at the table together, working from actual consumption data rather than vendor marketing.
If you’re heading into a renewal and your observability spend is hard to forecast, consider running a structured assessment—attribute spend by team and environment, identify the cost drivers, and build a roadmap that works whether you optimize your current platform, evaluate alternatives, or both.
Have questions about your observability costs? Reach out and let’s see how you can optimize without compromise.
About the Author
Brad Bell is the Principal Observability Lead at TekStream Solutions, a Digital Resilience partner that helps organizations operate, recover, and adapt with confidence by modernizing, securing, and optimizing their digital environments. His 29 years of experience spans large-scale telecommunications infrastructure, enterprise cloud strategy, and operational transformation across industries ranging from financial services to quick-service restaurants — work that included scaling monitoring platforms to 12,000+ nodes, architecting next-generation networks, and turning reactive ops teams into reliability engineering organizations. A Grafana Certified Solutions Architect and PreSales Solution Architect, he teaches SRE immersion courses at major financial institutions and consults on observability strategy at the enterprise level, helping clients navigate the convergence of cost pressure, tool sprawl, and AI-driven operations that is reshaping how enterprises think about reliability. His perspective isn’t theoretical — it comes from having been the person on the other end of a 2 AM page, and from watching organizations make expensive, avoidable mistakes with their observability investments. At TekStream, his focus is helping enterprises build platforms that solve today’s problems and hold up against where the industry is headed.