


Enterprise Security Threat Intelligence
By Kyle Moreau, Security Engineer
While there is a lot of information available for Enterprise Security’s threat intelligence platform, setting it up and understanding how it works with your data can get confusing. This article provides a simple approach to configuring and understanding how all the pieces come together.
Threat Intelligence is an invaluable tool that can assist your security team in detecting malicious activity in your environment. To enrich your data and utilize the vast amount of threat intelligence available, Splunk Enterprise Security comes with out-of-the-box threat intelligence sources, searches, and correlations. Configuring and customizing this tool is an foundational step you can take toward your threat intelligence journey.
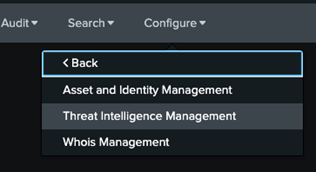
Start by navigating to the Enterprise Security App and open the configuration tab.
Enterprise Security -> Configure -> Data Enrichment -> Threat Intelligence Management
Under Sources you will see a list of pre-configured threat intelligence feeds. These sources are configured with a description, polling interval, type, source URL, and weight. By default, these sources are disabled.
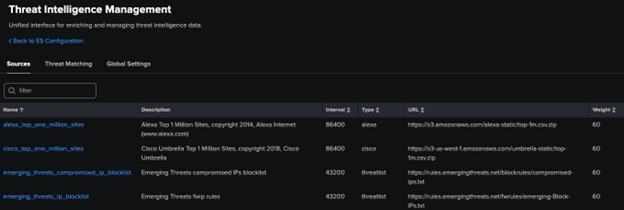
Once here, enable the intel sources you would like to use. Additionally, you can add your own intel sources. If you’d like to add your own intel, start by reviewing the supported collection types and required fields.
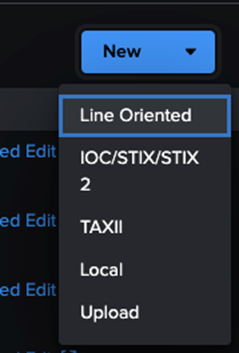
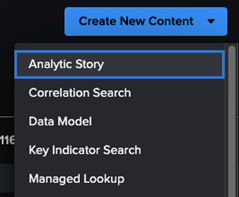
To configure an existing source, navigate to the upper right side of the Sources tab, select New. Then select the type of data source you will be gathering intel from.
To add a Local source, configure a Managed Lookup: Configure -> Content Management -> New Managed Lookup.
Threat Intel can come in so many different formats or processes. Custom Threat Intel sources, especially those tailored to your environment, would be a powerful tool to strengthen your security posture. If you have any questions about how to add a custom feed or include IOCs you’ve collected, fill out the form below and see how we can assist you.
To view a breakdown of the Threat Intel Artifacts, go to Enterprise Security -> Security Intelligence -> Threat Intelligence -> Threat Artifacts.
The Threat Matching tab contains the searches that generate threat activity data.
These searches pull IOC data together then search across a specific data model by select fields. For example, IP IOCs added from a source feed get compiled into a KV store lookup. The Threat Matching search for src searches those IP Addresses against logs from the Network, Web, and IDS data models. If there is a match, the activity will get listed under Threat Activity.
Threat Activity can be viewed by either searching index=threat_activity or the dashboard located at: Enterprise Security -> Security Intelligence -> Threat Intelligence -> Threat Activity.
Below is an example of a threat source IP Address matching a login attempt from an external actor.
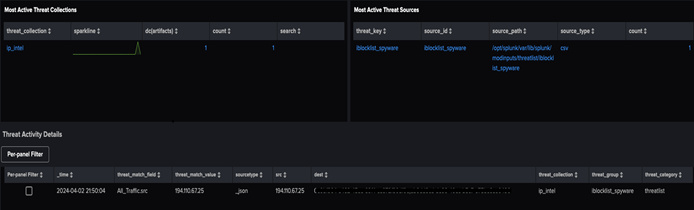
The threat activity log shows the source, time, and specifics about what IOC matched the data. In this case the IP Address is from the iblocklist_spyware source that comes with ES. Here we can perform additional searches to see why this address is on the list. The log source information can be used to pivot to the originating logs to gather context around the activity.
Getting hits like these fuels an investigation and can reveal malicious activity. From the hit above the following questions could be derived; Is this IP a residential ISP or a Cloud IP? Is this a typical location for this user? Is this an expected time of day to be logging in? Was the login successful? Were any other accounts targeted?
Reach out to a TekStream expert using the form below to discuss utilizing threat intelligence in your environment, customizing your intel feeds, validating sources, and getting the most out of what Splunk has to offer for threat intelligence. You can also read more Splunk Technical Blogs here, and learn about TekStream Splunk services here. Happy Splunking!