



















Splunk Cloud Cost Optimization: Data Model Acceleration — The Hidden SVC Multiplier
By Trevor Savage, Splunk Consultant II
If you run Splunk Cloud with Enterprise Security and you’ve ever audited your top SVC utilization by user, you’ve almost certainly missed one of your largest, most consistent compute costs. It isn’t a runaway dashboard or a power user with a bad habit of running index=*. It’s data model acceleration — and it hides in plain sight behind a system account most people never look at twice.
This isn’t a “turn off acceleration to save money” post. Accelerated data models are the backbone of Enterprise Security. Without them, your correlation searches and tstats-backed detections would crawl. The point here is narrower and more useful: DMA is a fixed, recurring SVC tax that’s easy to over-provision and almost impossible to see if you don’t know where to look. Once you can see it, you can right-size it without giving up the speed you’re paying for.
Why it’s hidden:
Two things conspire to keep DMA cost off your radar. First, acceleration runs whether anyone uses the model or not. A persistently accelerated data model runs summarization searches on a schedule — by default every five minutes — to keep its high-performance analytics store current. That’s roughly 288 summarization runs per model per day, every day, indefinitely, regardless of whether a single pivot, tstats search, or correlation rule ever touches it. Acceleration is a standing background process, not an on-demand one.
Second, and more importantly for an audit, it doesn’t run under a human’s name. On Splunk Cloud, summary refreshes, report accelerations, and data model accelerations are executed by the internal “splunk-system-user”, and that work consumes SVCs just like any other search. So when you pull “top SVC consumers by user” in the Cloud Monitoring Console, all of that acceleration compute collapses into a single system account that’s easy to scroll right past. The cost is real, it’s continuous, and the standard first-pass audit makes it invisible.
Why ES makes this worse:
Enterprise Security is the single most common reason a Splunk Cloud environment uses DMA. ES ships with the CIM data models, and the standard guidance is to accelerate the ones backing your detections. DMA is, by Splunk’s own description, one of the most resource-intensive parts of an ES deployment — so any inefficiency here is multiplied by the breadth ES encourages. The amplifier that bites hardest is index scoping. Each CIM model decides what to summarize based on its cim_<datamodel>_indexes macro. If you leave the macro empty, you’re paying extra to repeatedly confirm that the logs you need aren’t in every index.
Three patterns account for the overwhelming majority of wasted DMA spend:
Unused acceleration — models accelerated by default during ES setup whose underlying data sources were never onboarded, or whose detections were never enabled.
Unconstrained acceleration — models whose cim_*_indexes macros point at index=* (or close to it), forcing summarization to scan irrelevant data.
Redundant acceleration — identical summaries rebuilt independently across multiple search heads or search head clusters that could share a single summary instead.
None of these require disabling acceleration to fix. They require aiming it.
Running the diagnostics:
Run these from your ES search head.
1. Inventory every summary — size, state, and crucially, whether anyone uses it
| rest /services/admin/summarization by_tstats=t splunk_server=local count=0

| eval datamodel=replace('summary.id', ("DM_" . 'eai:acl.app' . "_"), "")

| eval size_mb=round('summary.size'/1024/1024, 2)

| eval last_access=strftime('summary.access_time', "%Y-%m-%d %H:%M:%S")

| table datamodel, eai:acl.app, summary.access_count, last_access, size_mb, summary.last_error, summary.time_range

| rename summary.* as *

| sort - size_mb 
This is your headline diagnostic. The size_mb column tells you what each model costs in storage, while access_count and access_time tell you whether that cost is buying you anything. A large, fully-built summary with a near-zero access count and a stale access time is the clearest signal of waste you’ll find — you’re summarizing data nobody queries.
2. Watch the actual summarization workload
index=_internal sourcetype=scheduler search_type=datamodel_acceleration

    earliest=-7d latest=now

| stats count AS host_runs, sum(run_time) AS host_sum_rt, max(run_time) AS host_max_rt

        by savedsearch_name host

| stats sum(host_runs) AS runs, dc(host) AS num_hosts, avg(host_runs) AS avg_runs,

        sum(host_sum_rt) AS total_runtime, max(host_max_rt) AS max_run_time

        by savedsearch_name

| eval avg_runs = round(avg_runs, 0),

       avg_run_time = round(total_runtime / runs, 1),

       max_run_time = round(max_run_time, 1)

| table savedsearch_name, runs, num_hosts, avg_runs, total_runtime, avg_run_time, max_run_time

| sort - total_runtime
This search highlights several important compute figures. total_run_time per model is a reasonable proxy for compute weight before you go to SVC metrics directly, and the runs and avg_run_time per acceleration fields allow you to go one layer deeper. With the default DMA cadence of every five minutes, each acceleration should have approximately 2016 runs/week/search head, so if the avg_runs field is notably higher or lower than 2016 this could warrant a review of the acceleration schedule and any potential errors. An additional thing to look out for here, is if any datamodel has a max_run_time, or even worse and avg_run_time of 3600 seconds. 3600 seconds ES default time limit for accelerations, and if reached, the acceleration will stop and any remaining unaccelerated data can be lost. If searches are hitting this limit, it is heavily recommended to review and triage the datamodel constraints and volume instead of increasing the limit.
3. Find the unconstrained-macro problem
| rest /servicesNS/-/-/data/models splunk_server=local count=0

| search acceleration=1

| eval macro_title = "cim_" . title . "_indexes"

| join type=left macro_title

    [ | rest /servicesNS/-/-/configs/conf-macros splunk_server=local count=0

      | rename title AS macro_title, definition AS index_macro

      | table macro_title, index_macro ]

| fillnull value=NULL

| table title, eai:acl.app, acceleration.cron_schedule,

        acceleration.earliest_time, acceleration.max_time,

        macro_title, index_macro

| sort title 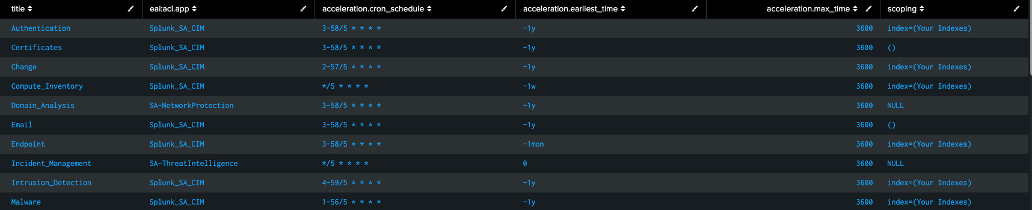
This search identifies which datamodels have index constraints. If the macros return indexes, you can be confident the acceleration searches are running much more efficiently than the macros that are only (). With the permissions of the splunk_system_user, () can be as bad as index=* running every five minutes. If the macro value is null, it can indicate the macro was never set up, it was not needed, or there are additional permission issues and should merit further review.
4. Confirm acceleration is actually keeping up
| tstats summariesonly=f count FROM datamodel=Network_Traffic

    WHERE earliest=-60m@m latest=-55m@m BY _time span=1m

| eval series="indexed"

| append [
    | tstats summariesonly=t count FROM datamodel=Network_Traffic

        WHERE earliest=-60m@m latest=-55m@m BY _time span=1m

    | eval series="accelerated" ]

| timechart span=1m max(count) BY series 
Swap in whichever model you’re investigating. A persistent gap between the indexed and accelerated series means summarization can’t keep up with ingest — you’re paying for acceleration and still falling back to raw data on every search. That’s a model that needs its scope tightened or its backfill reconsidered, not one that’s saving you anything yet.
Fixing it without throwing away the speed you paid for
The goal is to make acceleration deliberate. Every accelerated model should map to data you actually ingest and detections you actually run.
Disable what nothing uses. Cross-reference your summary inventory (search #1) against your enabled correlation searches and onboarded data sources. Any model with a built summary, near-zero access count, and no detection depending on it is a candidate to turn off. This is almost always the highest-ROI change in an ES environment, because default ES setups tend to accelerate broadly regardless of what’s actually been onboarded.
Scope the index macros. For every model you keep, make sure its cim_<datamodel>_indexes macro lists only the indexes that can plausibly contain that model’s data. This single change often cuts summarization compute dramatically because you stop scanning irrelevant indexes 288 times a day.
Tune the summary range. Each acceleration’s summary range should match how far back your detections and dashboards actually query, no further. The Splunk recommended range is 90 days. Additionally, a deep backfill range makes the initial build and every post-change rebuild scan enormous numbers of buckets. ES guidance is generally to keep backfill modest — on the order of 4–12 hours — to limit buckets scanned, unless you have a specific reason to summarize further back.
Share summaries across search heads. If you run multiple search heads or search head clusters accelerating the same CIM models, you may be rebuilding identical summaries independently on each. Summary sharing via acceleration.source_guid lets a reader model consume a writer model’s summary instead of building its own, eliminating redundant work. This is particularly relevant for multi-stack or MSP-style deployments and is the lever fewest people know exists.
Mind the rebuild storms. Every time you change a data model’s definition, its summaries rebuild. With the default allow_old_summaries=false, searches fall back to raw data during that rebuild — so a careless CIM tweak triggers both a compute spike and degraded search performance simultaneously. Batch your model changes, make them during low-usage windows, and understand that “just adjusting a field mapping” has a compute cost on the back end.
Make it a habit, not a cleanup
DMA cost isn’t a one-time project because your environment isn’t static. New data sources get onboarded, detections get enabled and disabled, ES content updates ship new models. Build the summary inventory search into a recurring review — quarterly is a reasonable cadence — and treat any accelerated model that isn’t earning its keep as a finding.
The takeaway isn’t that acceleration is expensive and should be avoided. It’s that acceleration is a deliberate trade of compute for speed, and the waste lives entirely in the unused, unconstrained, and redundant corners of it. A handful of well-aimed, well-scoped accelerated models is exactly what you want in an ES deployment — it’s what makes your detections fast and your analysts productive. The hidden multiplier only works against you when you stop paying attention to what you’ve accelerated and why.
About the Author
Trevor has over 6 years of experience in the Information Technology field, with 3 years of experience in Cybersecurity and a specific focus on Splunk. He has worked with Splunk cloud as well as Splunk Enterprise on-prem. He has strong knowledge of configuring, deploying, and tuning detections as well as setting up Splunk Enterprise Security. He has experience with integrating many security tools with Splunk and normalizing that data for efficient querying. He currently holds Splunk’s Core Certified Consultant certification.