


Splunk for Monitoring: Pinger APP!
By Bryan Bollou, Splunk Consultant
One of the many uses for Splunk is monitoring an environment and its assets. This can be done in different ways and this article highlights two of them.
The first is through monitoring of the logs the machines are supposed to be sending to Splunk. If a log successfully gets to Splunk this shows the log generation, Splunk forwarding and Splunk service are working/running. If a host stops sending logs, it can be an indication that the machine is down. In some environments, however, logs may stop due to system restarts, configuration changes, low traffic times, etc. Here the host is up but is not sending logs (at the moment). This means the simplest way of checking if a machine is up can still be useful – ping. This will be the second method discussed in this blog post to monitor assets reporting a Splunk environment.
Monitoring Hosts with Logging
Monitoring hosts with logging involves first understanding what logs are expected and establishing a time threshold for when they are “stopped”. This threshold can differ as some logs are expected to be constantly noisy such as firewalls, while others could be based on user activity and/or time of day such as transaction logs.
The following SPL searches can be used to get visibility on the current indexes and whether they have received logs after a certain period of time:
Find and List all Indexes
| eventcount summarize=false index=* index=_*
| dedup index
| fields index
Look at indexes in the last 24 hours, if they have not sent logs in the last 5 minutes, list them out.
| tstats latest(_time) as latest where index=* earliest=-24h by index
| eval recent = if(latest > relative_time(now(),"-5m"),1,0), realLatest = strftime(latest,"%c")
| where recent=0
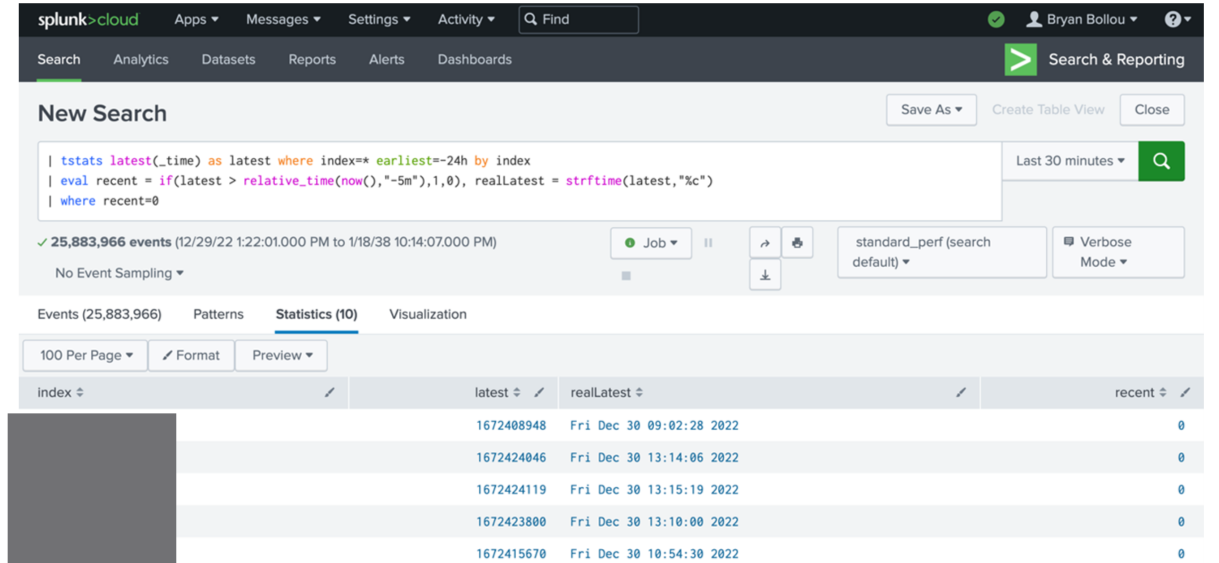
The results of this search could be used to make an alert for when an index stops receiving logs. This, however, could be too general if you have multiple hosts sending to a particular index. Thus, splitting the search by host could yield more specific and useful results.
Look at hosts in the last 24 hours, if they have not sent logs in the last 5 minutes, list them out.
| tstats latest(_time) as latest where index=* earliest=-24h by host
| eval recent = if(latest > relative_time(now(),"-5m"),1,0), realLatest = strftime(latest,"%c")
| where recent=0
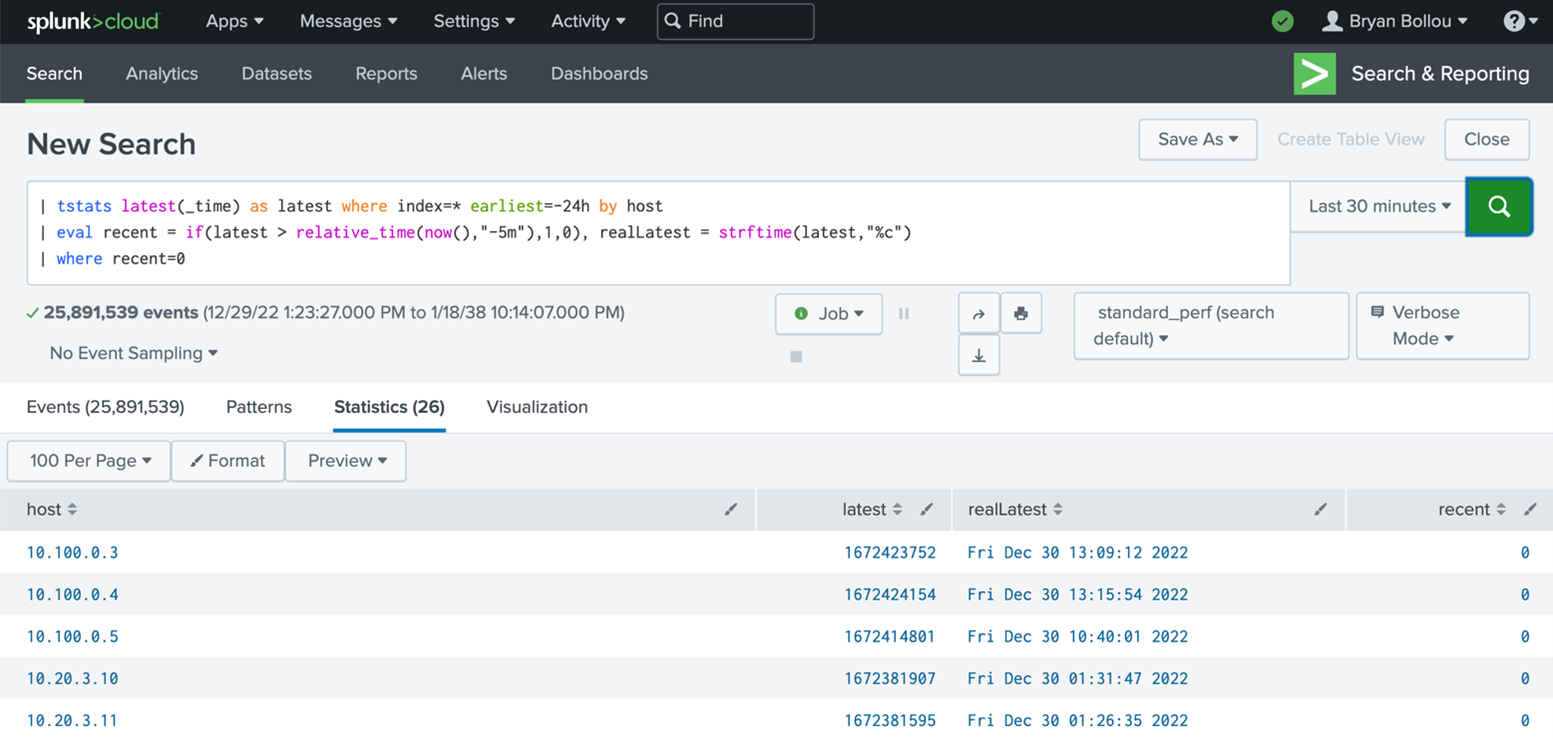
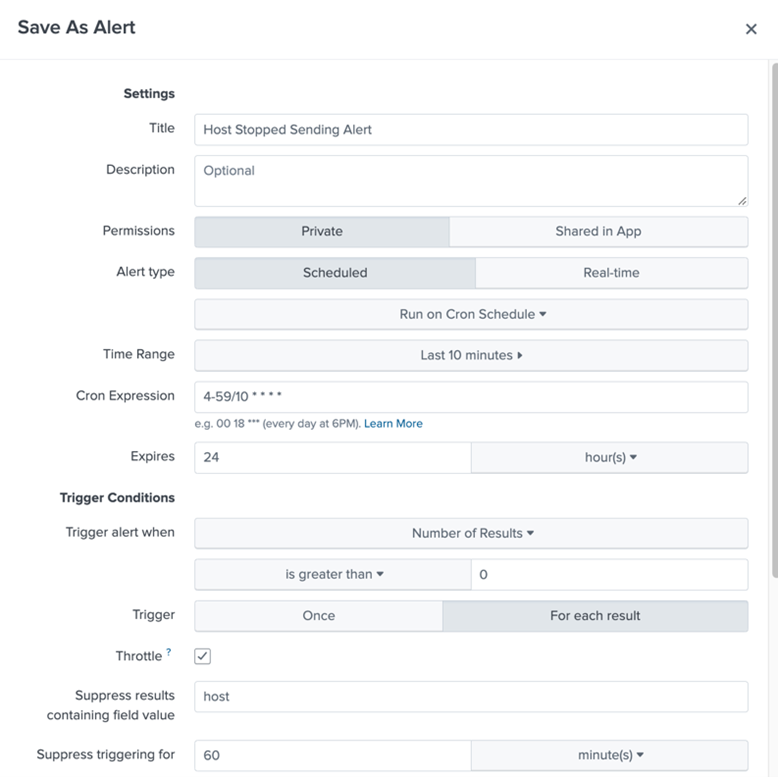
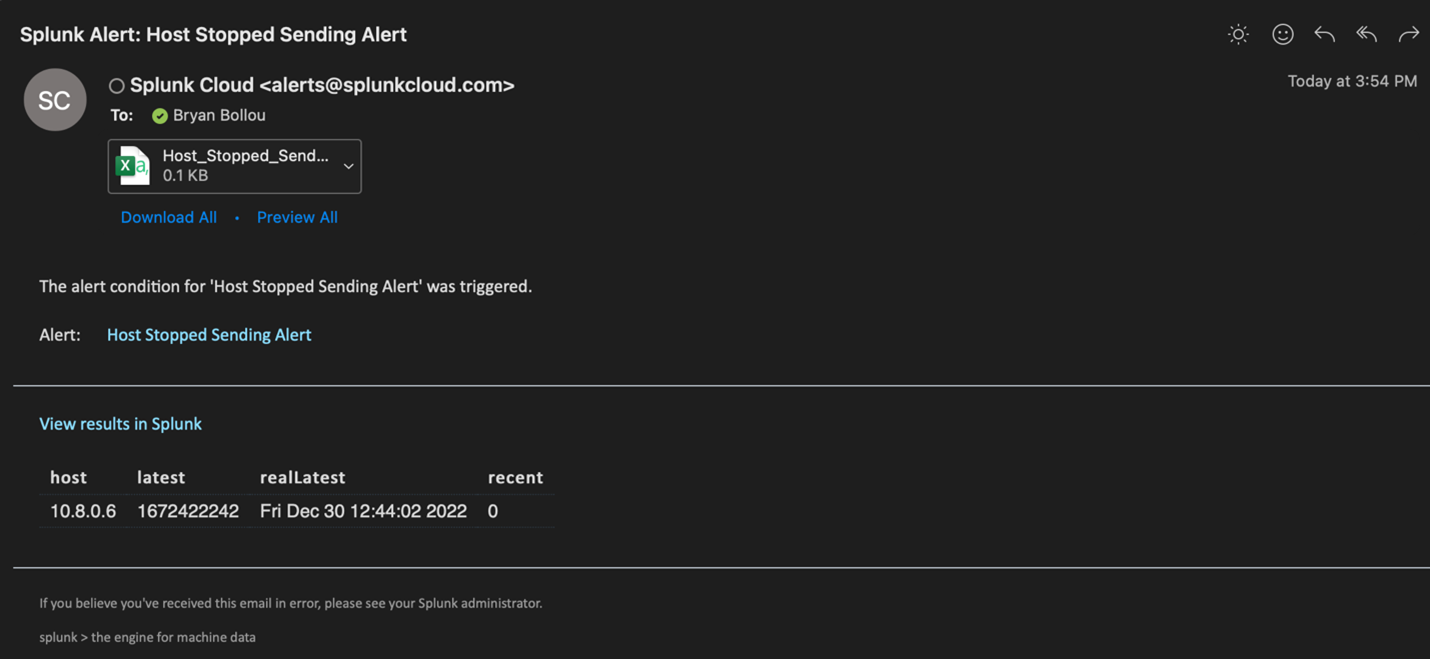
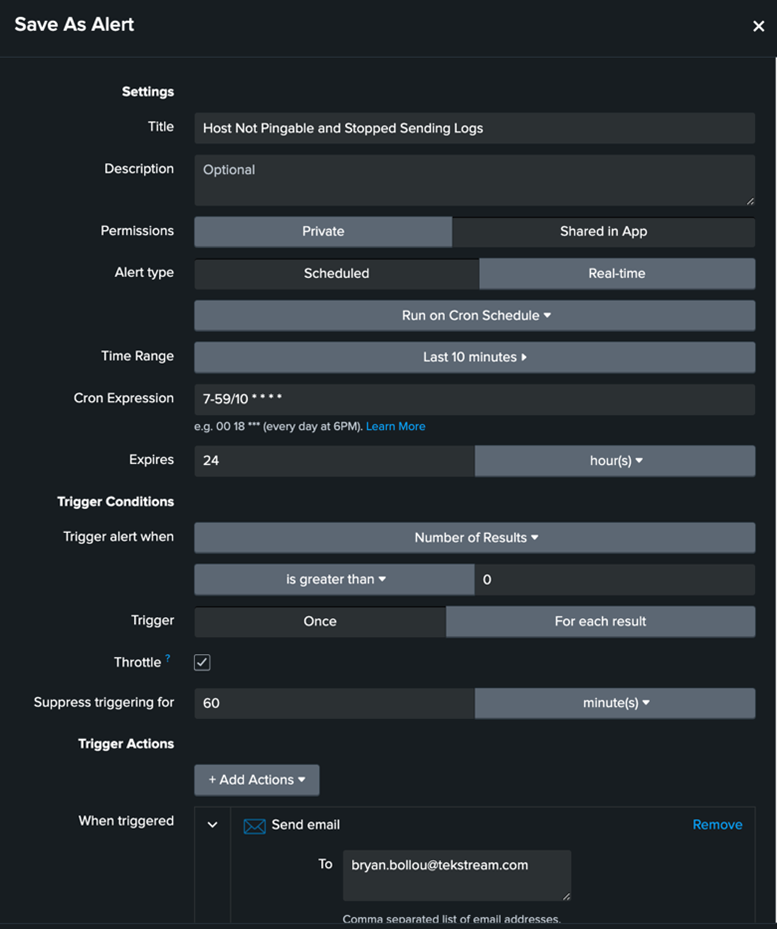
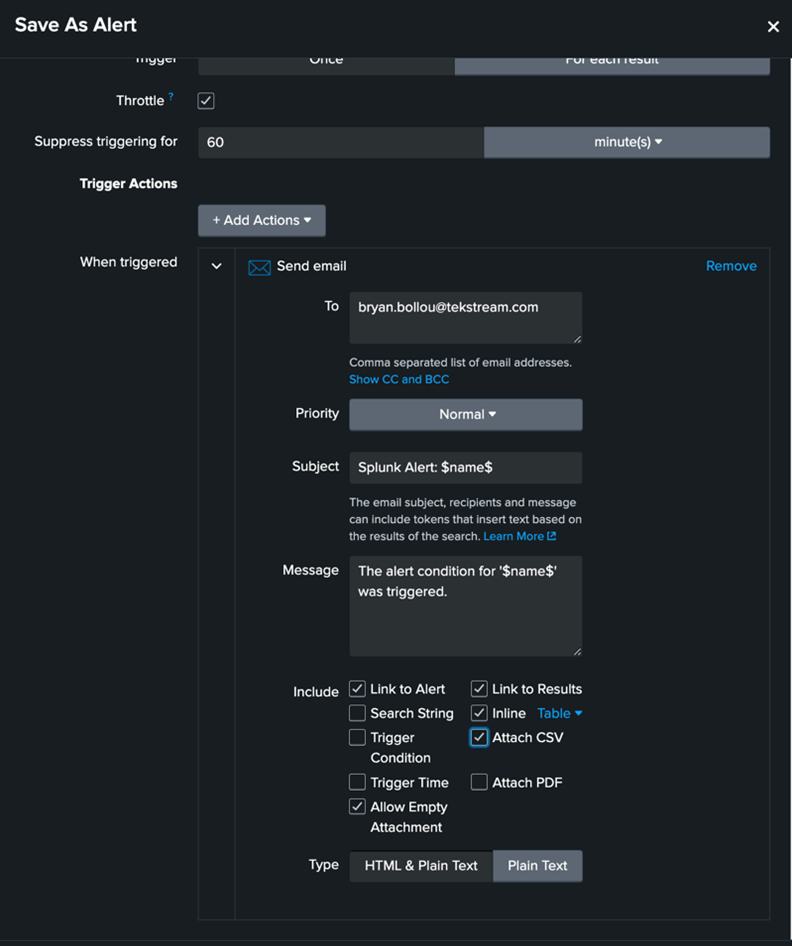
This SPL can be saved as an alert with the parameters below to get an alert that tells a customer whenever one of their hosts stops sending logs to Splunk for X amount of time (5 minutes in this example).
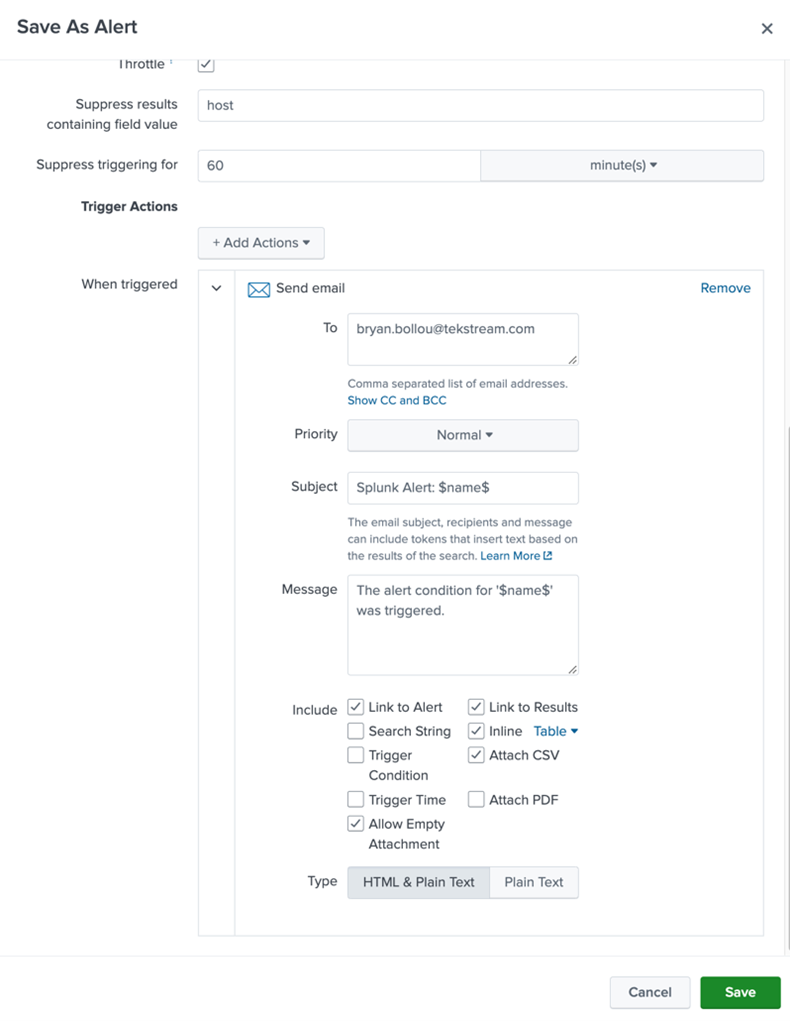
An email alert action would look something like this:
To expand on the above alert, we can use Splunk to find out if machine is up or down based on ping status. For this, I will go over an app I created to ping machines in a lookup file and send the results in an event format to Splunk.
A prerequisite for this app and the script below to work is for the machine (where the script resides) to be able to ping all other machines it targets. For larger and segregated environments, the script can be deployed to multiple machines that have different “ping access” in order to have more coverage.
Below is the commented bash script that looks at the lookup tables in the pinger app directory and pings them one by one. Note: depending on if it is a full Splunk install or Splunk Universal forwarder the LOOKUP_LOCATION variable will be different. Line 6 needs to be uncommented for the former (full) and Line 5 for the latter (universal forwarder). Machines that are pinged and respond will print an “up” status log and those that don’t will print a “down” status log.
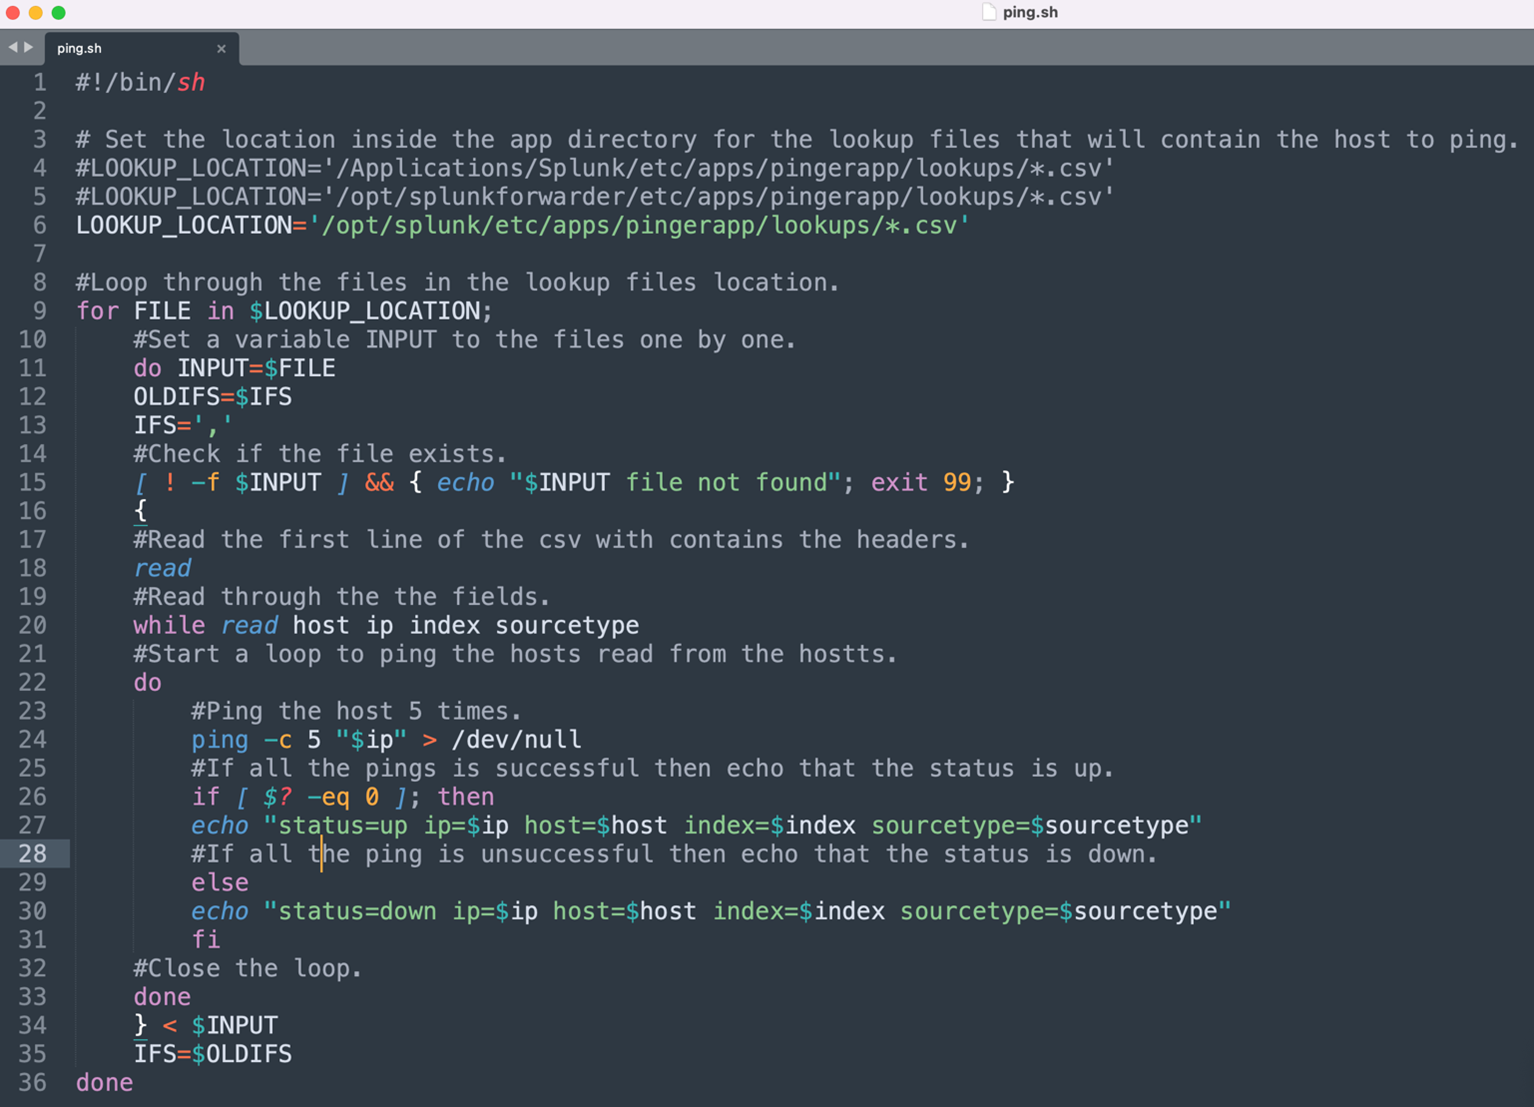
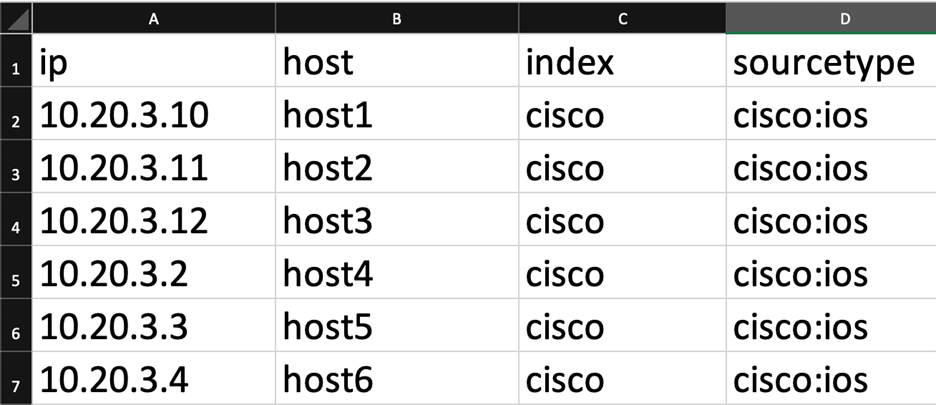
The script currently looks for a csv with the headers, “ip”, “host”, “index” and “sourcetype” – in that order. This can be changed by modifying line 20. An example of lookup file this script would work with is here:
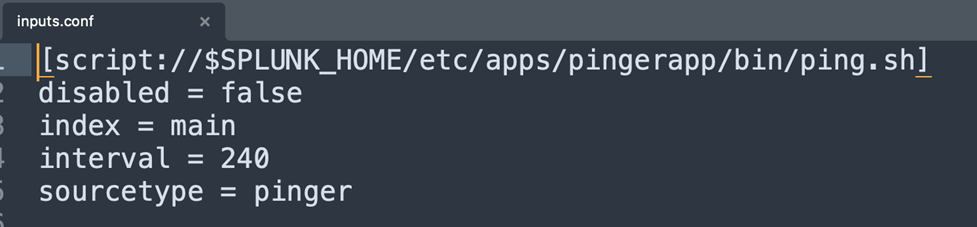
Along with the script, an inputs configuration is needed to point to the script above and run it on at an interval. In this example the interval is 240 seconds or 4 minutes. The results of the script will then be forwarded to the index main and have the sourcetype pinger.
To ensure the logs that are sent to Splunk come in a good format, a props configuration needs to be created. In the below configuration, the sourcetype pinger disables line merging and has the default newline line breaker. The logs do not have a time stamp and will take the time the script is ran on the machine.
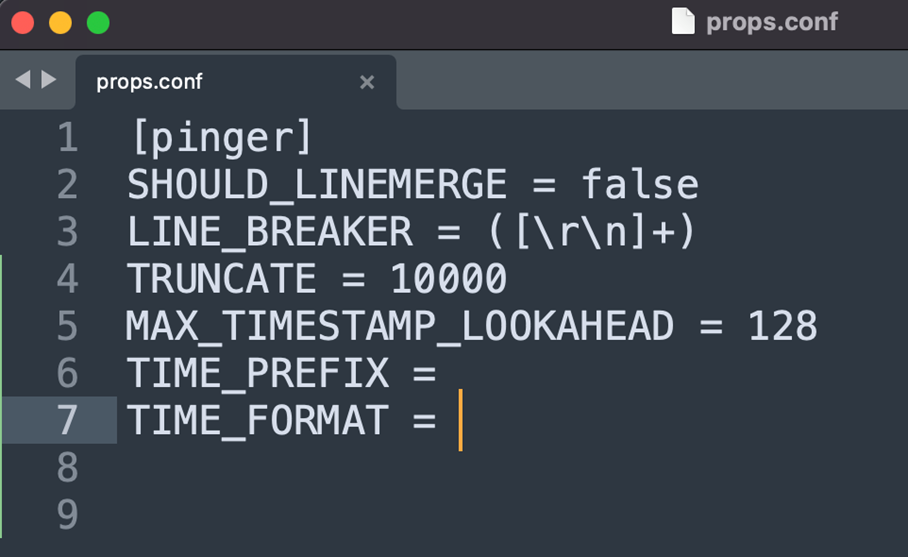
This props configuration needs to go on the first full instance of Splunk the pinger app’s logs will touch. For example, let’s say the pinger app is on a universal forwarder that forwards its logs to a heavy forwarder before being sent to an indexer in a Splunk Cloud instance. In this case, the props.conf would be needed on the heavy forwarder. If the universal forwarder sent logs straight to Splunk Cloud, the props.conf would need to be on the Splunk Cloud Indexers. If the pinger app is installed directly on a heavy forwarder as opposed to a universal forwarder, the props.conf app needs to be on the heavy forwarder instance.
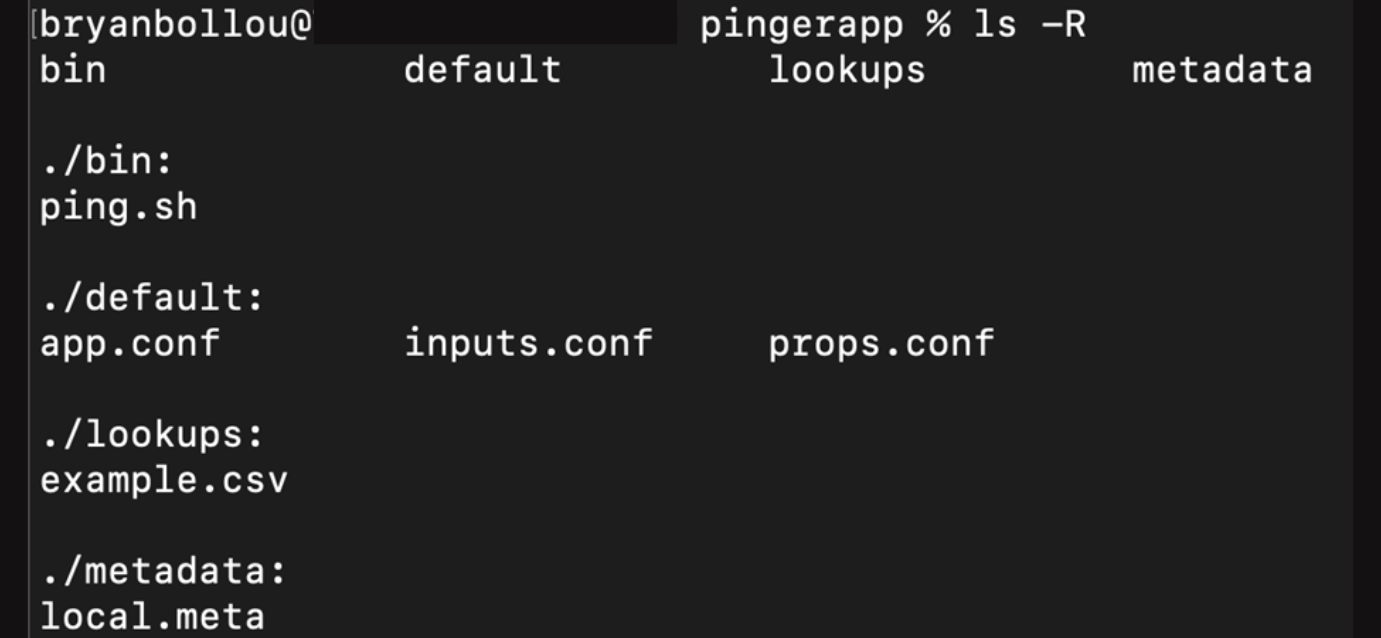
Below is an example of the structure of the pinger app. The script goes into the app_name/bin directory. Lookup tables with the hostnames and ip addresses to ping will go under the app_name/lookups directory. The configuration files will go under the app_name/default directory.
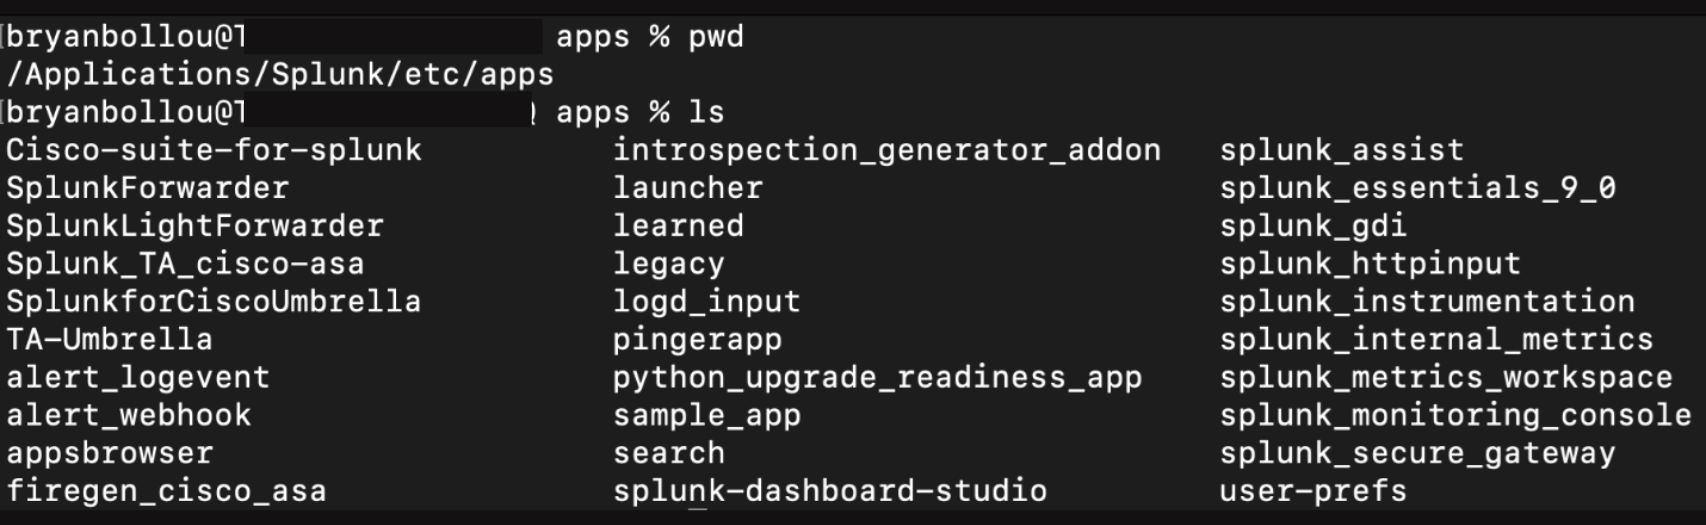
The app will reside in the $SPLUNK_HOME/etc/apps, for example:
To check if the app will work for the machine it is installed on, you can navigate to the $SPLUNK_HOME/etc/apps/pingerapp/bin directory and run the script manually.
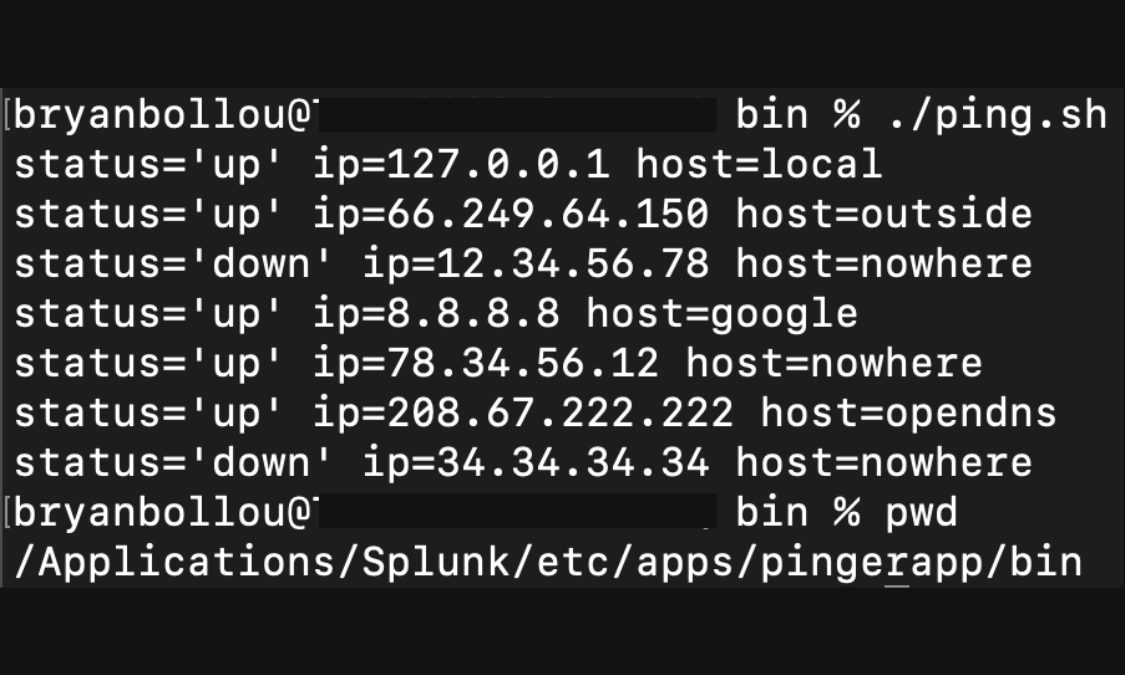
Once the app is properly installed and the Splunk instance is restarted, the script will start generating logs and forwarding them to the appropriate index. The logs would appear like below:
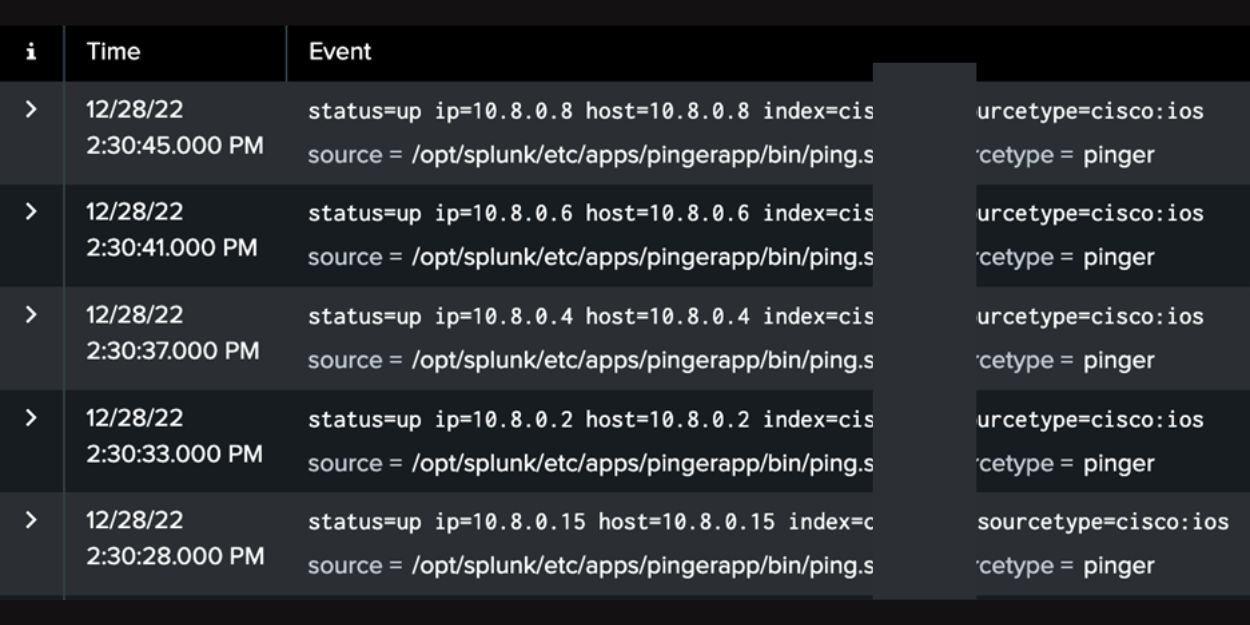
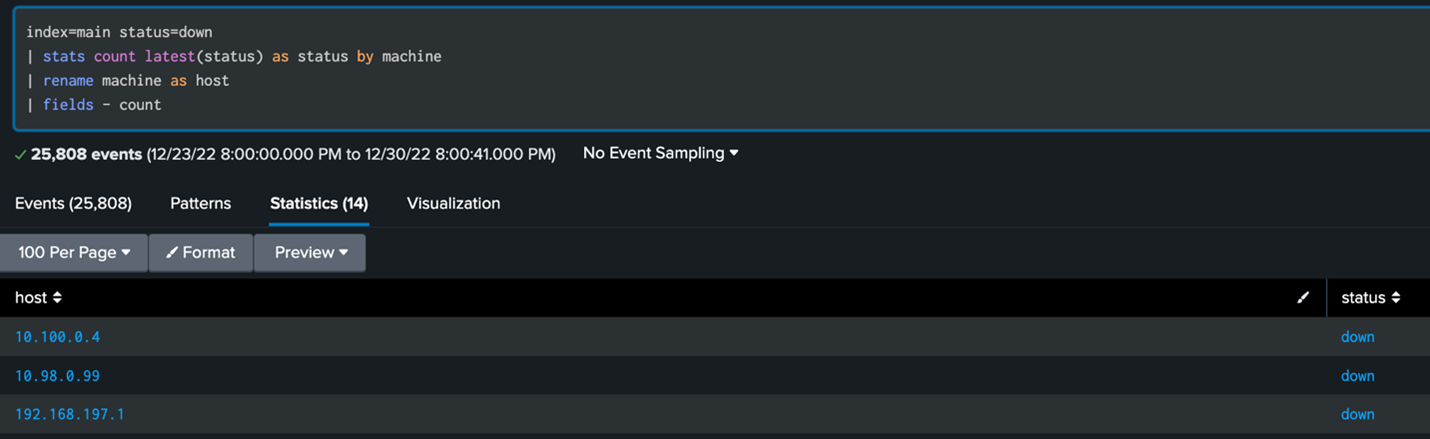
These logs can be then used to discover the machines with the latest status of “down” (their last ping test did not return results as per the script). This represents a machine that is not currently pingable in an environment.
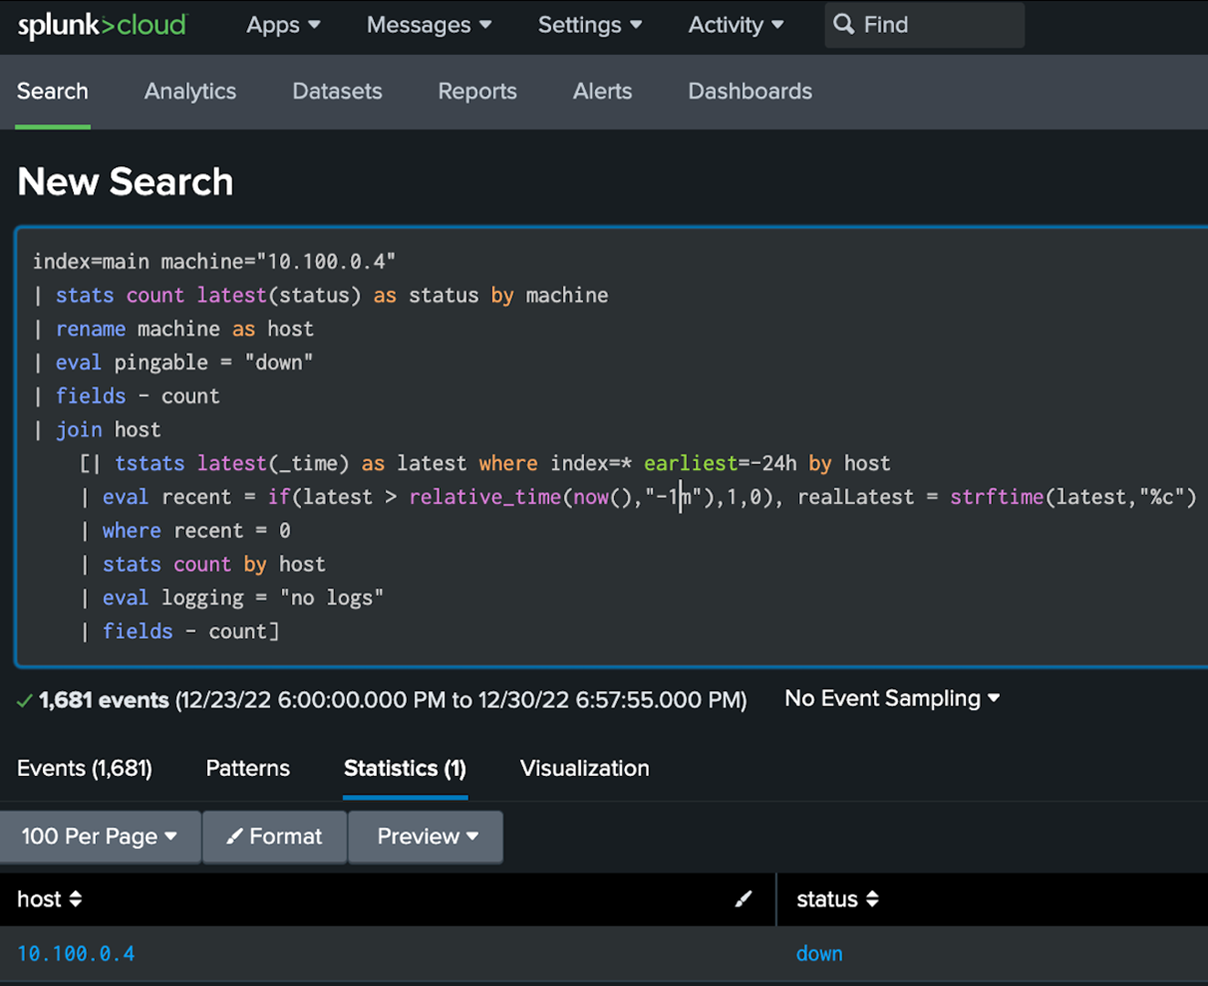
To get the best of both “monitoring” worlds, a combined search can be used. A prerequisite for this to work is that the hostnames and/or ip addresses for the machine sending the logs and how it’s pinged, need to match. A joined search like the one below can then be used to get a list of the hosts that stopped sending logs then feed it into a search looking for hosts that are not pingable.
This can be made into an alert like this:
Tools like this alert and the customizable pinger app can be used to enhance the monitoring capabilities of Splunk. For questions on how to make this script more customizable for your environment or how to use Splunk to monitor your assets, ask one of our consultants by filling in the form below. Happy Splunking!