


Predict Your Incident Tickets With Splunk MLTK
Experimenting with Forecast Time Series Workflow
By Kamal Dorairaj, Senior Splunk Consultant
This blog details a step-by-step process on how to create and run a prediction model with Splunk MLTK. The use case explained is specifically showing how to predict the number of incident tickets created for an Operations Team during a busy holiday time, so the team can prepare for the workload. Here are my guidelines for the prediction model.
Experiment
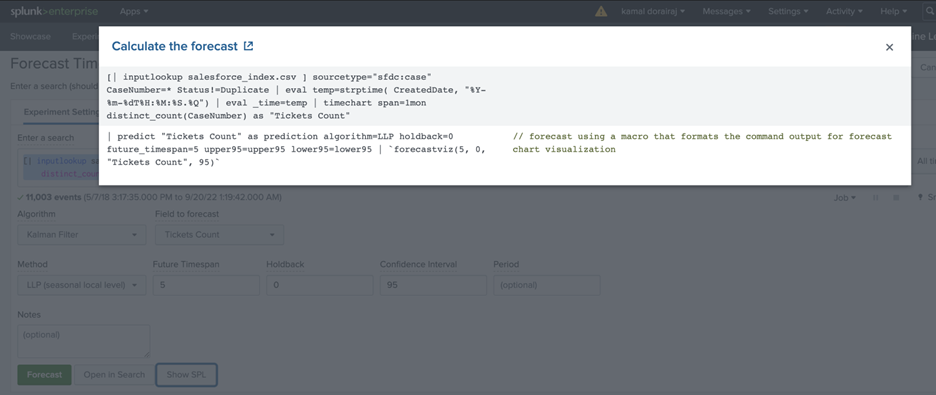
The experiment predicts the number of incident creation tickets for each month in Salesforce, for the next five months. The Forecast Time Series experiment assistant workflow is used for this use case. The FTS Assistant predicts the next value in a sequence of time series data, and the result includes both the predicted value and a measure of the uncertainty of that prediction.
Follow these steps to create a Forecast Time Series Experiment:
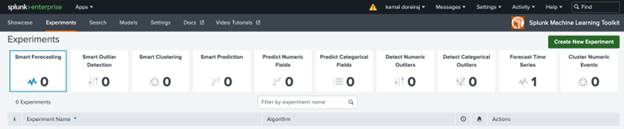
Go to Apps -> Splunk_ML_Toolkit -> Experiments.
Click on Create New Experiment
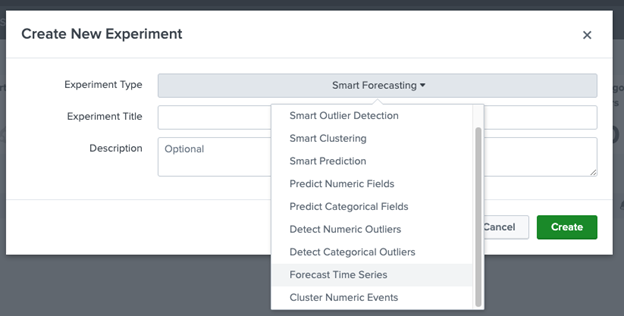
Select Forecast Time Series from the dropdown
Complete the Experiment Title and Description and click Create. (Both the name and description can be edited later if needed)
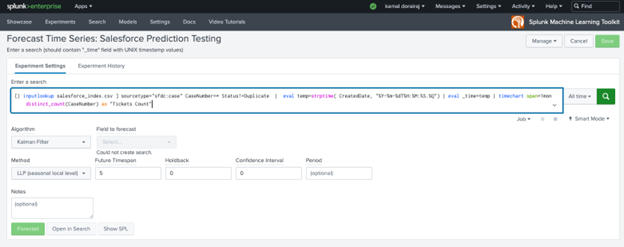
Build The SPL
Creating the SPL is the 80% of the work. The SPL should filter the condition appropriately to a specific numeric field value. The below SPL is an example where the search scans thru the past four years of salesforce incident tickets count through the input lookup with a one month span. Develop similar SPL based on your data sources.
[| INPUTLOOKUP SALESFORCE_INDEX.CSV ] SOURCETYPE=”SFDC:CASE” CASENUMBER=* STATUS!=DUPLICATE | EVAL TEMP=STRPTIME( CREATEDDATE, “%Y-%M-%DT%H:%M:%S.%Q”) | EVAL _TIME=TEMP | TIMECHART SPAN=1MON DISTINCT_COUNT(CASENUMBER) AS “TICKETS COUNT”
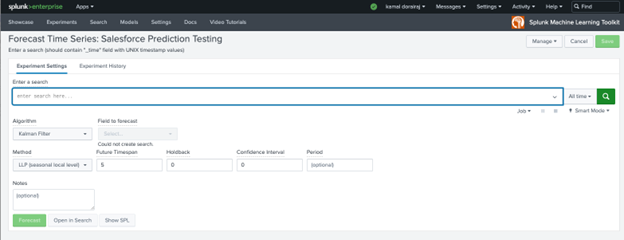
Algorithim
Select the Kalman Filter algorithm from the Algorithm dropdown. A good understanding of each algorithm is needed to use the algorithm that works best for our use case. The Kalman Algorithm considers subsets of features such as local level (an average of recent values), trend (a slope of line that fits through recent values) and seasonality (repeating patterns).
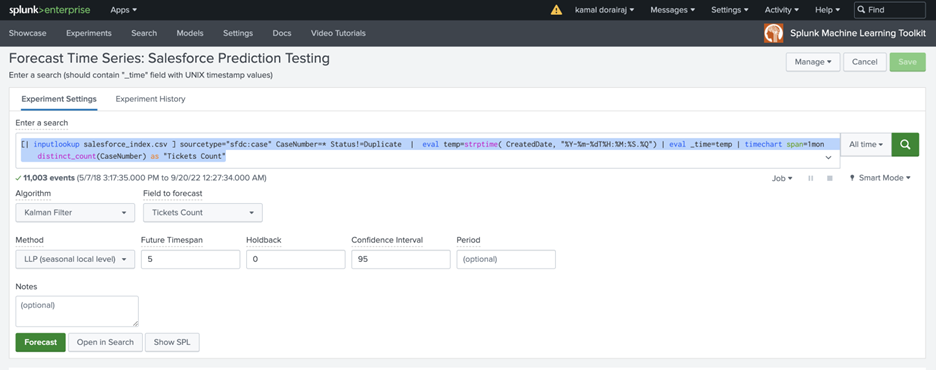
From the Field to Forecast list, select the Tickets Count field which we want to forecast for this use case.
Next, specify 5 in the Future Timespan field, which is 5 months of future data we want to forecast.
Then, specify 95 in the Confidence Interval field, which is the percentage of the future data you expect to fall inside of the confidence envelope.
All other fields are optional and can be used based on the use case.
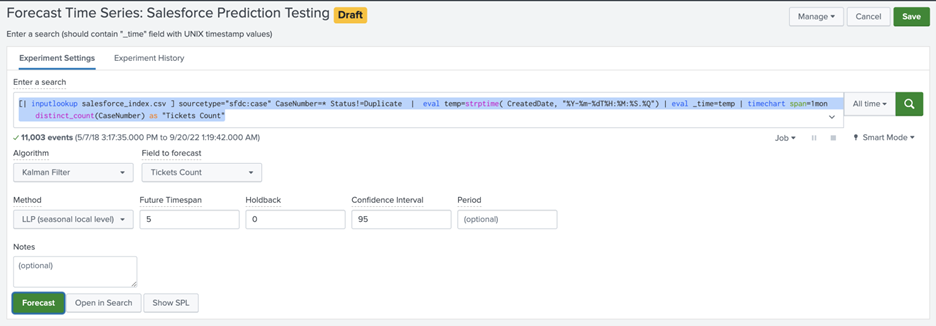
Forecast
Click on Forecast. The math behind the algorithm gets applied on the search results and will produce the results of the next five-month prediction count.
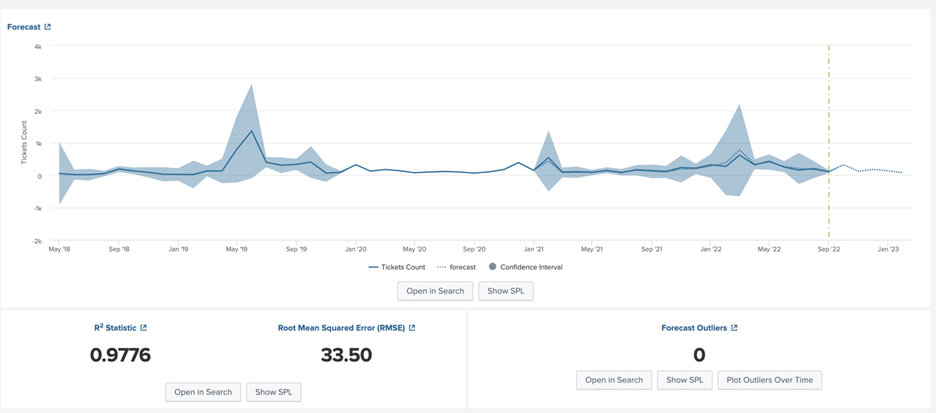
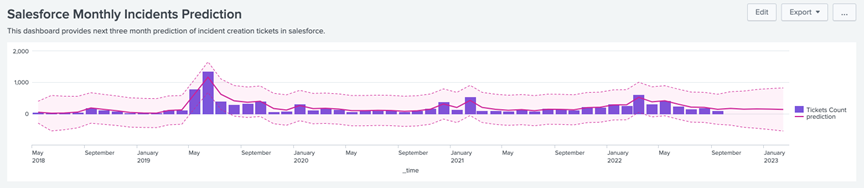
Definition of The Variables
After you forecast a time series, review your results in the following tables and visualizations.
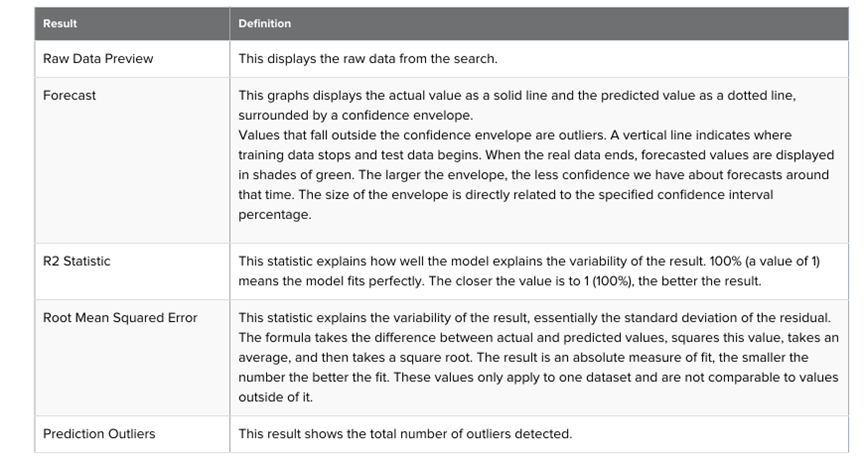
Run The Model
Click on the Show SPL to generate a new modal window/overlay showing the search query you used to forecast. Copy the SPL for future use in other aspects of your Splunk environment.
Once you are getting valuable results from your experiment, save it. Saving the experiment results in the following actions:
Assistant settings saved as an experiment knowledge object.
The Draft version saves to the experiment Listings page.
Any affiliated scheduled trainings and alerts update to synchronize with the search SPL and trigger conditions.
Load a saved experiment by clicking the experiment name.
Within the experiment click Open in Search to generate a new search tab for this same dataset. This new search will open in a new browser tab, away from the assistant. This search query uses all data, not just the training set. You can adjust the SPL directly and see results immediately. You can also save the query as a Report, Dashboard Panel or Alert.
Experiments are always stored under the user’s namespace, which means that changing sharing settings and permissions on experiments is not supported.
Now you know how to create and run a prediction model with Splunk MLTK. Let us know if your model works, and if you have any questions after running your next prediction. Happy Splunking!