InfoSec App on Splunk Cloud – Part 2: Deep Dive into App Dashboards and Knowledge Objects
By Khristian Pena, Team Lead, Enterprise Security
This blog is the 2nd and final half of a two part blog post on the free to use InfoSec security app on Splunk. Catch up with Part 1: Installing and Configuring where we highlight prerequisites for installation, as well as how to install the app.
The InfoSec app is a collection of comprehensive, extensible dashboards and alerts that focus on the most common security-oriented technology components within your typical corporate environment. Use this app on Splunk to investigate incidents and automate compliance tasks. You’ll also help protect your network, users and intellectual property from external adversaries and malicious insider threats. Use the app to provide executive-level reporting metrics, trends, and summaries. Assist in completing audits by mapping customizable reports to common compliance frameworks such as NIST, HIPAA, PCI, and ISO.
After installation, and before any of the dashboards start working, you will need to confirm that your ingested data is normalized and all required data models are accelerated: Authentication, Change, Intrusion Detection, Malware, Network Sessions, Network Traffic, Endpoint, Web.
Validate data sources that feed the InfoSec app for Splunk data model
Validate the data sources for each of the data models that are listed on the Health dashboard of the Splunk InfoSec app, even if the Health dashboard reports that data is fed into the data model. If only partial data is fed into the data models, you might need to adjust your configuration to ensure full coverage of your Splunk Platform. Additionally, your data sources might feed more than one data model.
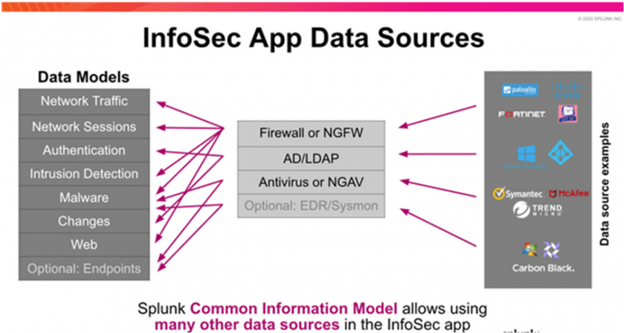
The following diagram shows some of the data sources that feed into the data models for the InfoSec app, including firewall, LDAP, and antivirus data:

Validate data model configuration
Follow these steps to validate data model configurations and to check that the data sources feed the data models as expected:
Step One: Use the following search to identify the indexes and source types that feed each of the InfoSec data models:
| makeresults | eval datamodels = "Authentication:Change:Endpoint:Intrusion_Detection:Network_Sessions:Network_Traffic:Malware:Endpoint.Processes:Web" | makemv delim=":" datamodels | mvexpand datamodels | map search="| makeresults | eval notfound=\"*** NO DATA FOUND ***\" | append [| tstats count from datamodel=$datamodels$ by index, sourcetype] | eventstats count as events |eval datamodel=\"$datamodels$\", index=coalesce(index,notfound)| search NOT notfound=* OR events=1 | table datamodel, index, sourcetype,count" | sort datamodel, index, sourcetypeIf the results of the search indicate that each of the required data models for the InfoSec app is populated with data, you can accelerate the data models. See Accelerate data models to build InfoSec app dashboards.
If the results of the search indicate that all the required data models for the InfoSec app are not populated with data, proceed to the next step.
Step Two: Identify the tagged events to configure the data models that are required by the InfoSec app within your Splunk Platform environment. To identify the tagged events and configure your data models, see Identify tagged events to configure data models.
Step Three: Repeat the process for each data model.
Identify tagged events to configure data models
Follow these steps to identify tagged events and to configure the data models. This example uses the Authentication data model, but you can follow these steps to identify tagged events for any data model:
- On the Splunk Platform menu bar, select Configure > Settings > Data models.
- Select the Authentication data model from the list of data models.
- Use the search bar to identify the events that must feed the Authentication data model.
(`cim_Authentication_indexes`) tag=authentication NOT (action=success user=*$)The first part of the search contains a macro calledcim_Authentication_indexes. This macro constrains the search to certain indexes. You must restrict a data model to only the indexes that feed it with data. The next part of the searchtag=authenticationconstrains the search to return events that are tagged as authentication events. The last part of the searchNOT (action=success user=*$)excludes any event that contains a field with the labelactionthat has the valuesuccessAND the fielduserthat has a value that ends with the$character. - Identify the data sources in Splunk that might fit your search. For more information on identifying data sources, see Identify data sources that feed data models.
Accelerate data models to build InfoSec app for Splunk dashboards
Accelerate data models after you confirm that the correct event data is fed into the data models that are required for the Splunk InfoSec app. You must accelerate each of the data models. You can only accelerate the data models after you confirm that they are fed with the correct event data because after acceleration, the data models cannot be edited without first disabling the acceleration.
Accelerate a data model
Perform the following steps on all the data models that are fed event data. This example uses the Authentication data model, but you can follow these steps to accelerate any data model. Don’t accelerate a data model that contains no event data.
- On the Splunk Platform menu bar, select Configure > Settings > Data models.
- Identify the Authentication data model. Do not click on the ”’Authentication”’ data model because you must work within the current web page.
- From the Actions column, select Edit > Edit Acceleration.
- In the Edit Acceleration dialog box, perform the following actions:
- Check Accelerate.
- Set the Summary Range to a suitable time frame.
- Click Save.
- When the Splunk platform starts to build the data model accelerations, track the progress of the accelerations from the Health dashboard of the InfoSec app. The InfoSec app is configured to work with your data sources.
- View each of the InfoSec app dashboards from the menu bar starting with Security Posture.
- Confirm that all the dashboards are populating with data. If you find a dashboard that is not populating, you might not have the required data source within your Splunk platform to feed the dashboard. For more information on troubleshooting, see Troubleshoot the Splunk InfoSec app.
Identify data sources that feed data models
Follow these steps to identify the data sources that feed the data models:
- Open a new Splunk Platform search window in another tab of your browser.
- Click Search & Reporting.
- Select Open Link in New Tab.
Before switching to the new browser tab, highlight and copy the search from the tab you are in and paste it into the search bar in the new browser window. - Run the search in the new tab.
- Modify the search to include all the indexes within your Splunk environment.
- Run the following search to see if any results are returned:
index=* tag=authentication NOT (action=success user=*$) | stats count by index, sourcetypeModify the search macro for the data model if your search results show indexes and data sources. For more information on modifying the search macro, see Modify the search macro for the data model.
Modify the search macro for the data model
Take note of the name of the indexes returned by the search in Identify the data sources that feed the data models so that you can update the macro.
Follow these steps to modify the search macro for the data model. This example uses the Authentication data model which is fed by the demo_oracle and demo_wineventlog indexes, but you can follow these steps to modify the search macro for any data model:
- On the Splunk platform menu bar, select Configure > Settings.
- Open Advanced Search under the Settings menu.
- Open Search Macros.
- Search for the
cim_Authentication_indexesmacro. You might need to adjust the filter to find the macro. - Set the app context to All and type cim_authentication_indexes into the search filter.
If the definition is set toindex=main, the Authentication data model was not fed data. - Click on the macro name to edit the macro.
- Change the Indexes Allowlist to include the indexes that were identified in the previous step.
- Click Save.
- Rerun the following original data model search to verify that the change to the search macro was successful.
(`cim_Authentication_indexes`) tag=authentication NOT (action=success user=*$) - Repeat this process for all of the following InfoSec data models: Authentication, Change (for app version 1.6.x and higher) or Change Analysis (for app version 1.5.3 and lower), Intrusion_Detection, Malware, Network_Sessions, Network_Traffic, Endpoint, Web
Dashboards
| Dashboard | Function |
| Security Posture | Provides a high level view to monitor the security in your Splunk environment. For more information to monitor your security posture, see Monitor your security posture using the InfoSec app for Splunk. |
| Continuous Monitoring | Comprises of the following dashboards that continuously monitor your Splunk environment: Windows Access and Changes dashboard to view events in MS WindowsAll Authentications dashboard to view all authentication actionsMalware dashboard to view antivirus solutionsIntrusion Detection (IDS/IPS) dashboard to view intrusion detection and prevention systemsFirewalls dashboard to view firewall eventsNetwork Traffic dashboard to view firewall data in your networkVPN Access dashboard to view VPN session data For more information to continuously monitor your Splunk environment, see Monitor your environment continuously using the InfoSec app for Splunk |
| Advanced Threat | Comprises of the following dashboards that leverage the power of the Splunk Platform’s search capabilities to highlight security events of interest: Access Anomalies dashboard to identify security risksNetwork Anomalies dashboard to identify network anomaliesCustom Use Cases dashboard to incorporate custom searches and dashboards For more information to highlight interesting security events, see Identify advanced threats using the InfoSec app for Splunk |
| User & Host Investigation | Helps to investigate user and host-based behaviors and actions For more information to investigate user or host behaviors, see Investigate behaviors using the InfoSec app for Splunk |
| Compliance | Provides visibility into controls that are required under different compliance frameworks. For more information to set up up visibility into compliance requirements, see Set up controls using the InfoSec app for Splunk. |
| Executive View | Provides a high-level view of certain security metrics and the environment status. For more information to report on high level security metrics, see Display high level security metrics using the InfoSec app for Splunk |
| Alerts | Helps to investigate and manage alerts For more information to investigate and manage alerts, see Manage alerts using the InfoSec app for Splunk |
| Health | Performs a health-check of your Splunk environment For more information to perform a health check, see Perform a health check using the InfoSec app for Splunk |
I hope this is helpful for when you are ready to begin using Infosec. The tool is a powerful addition to your security suite and will quickly help your organization improve its security posture and overall visibility into your environment.

