

Optimizing Splunk Dashboards with Post-Process Searches
Optimizing Splunk Dashboards with Post-process Searches
When creating Splunk dashboards, we often have the same search run multiple times showing different types of graphs or with slight variations (i.e. one graph showing “allowed” and another showing “blocked”). This creates more overhead every time the dashboard is opened or refreshed, causing the dashboard to open or populate more slowly and increasing the demand on the Splunk infrastructure. There are other situations or limitations that occur such as user concurrent-search limits.
With proper optimization techniques a full typical dashboard with 10 panels can run less than three Splunk queries versus the 10 individual searches that would normally run. This is accomplished by using Post-process searches that are easily added in the SimpleXML of the desired dashboard.
Starting Point of Post-process Searches
When running a search in Splunk it will return RAW event data or transformed event data. Transformed event data is data that was returned by a search and is placed in the form of statistical tables which is used as the basis for visualizations. The primary transforming commands are:
- Chart
- Timechart
- Top
- Rare
- Stats
The Post-process search is known and referred to as a base search. The base search should always avoid returning RAW events and instead return transformed results. This is largely due to one of the limitation of Post-process being it can only return a max of 500,000 events and it will truncate without warning. To circumvent this limitation, it is best practice to use one of the transforming commands and as always, refine your search as much as possible to reduce the number of results and reduce your search .
The Documented Limitations of Post-Process Searches
The documentation that is provided on Splunk Docs show a few limitations that you should consider before using the Post-process search:
http://docs.splunk.com/Documentation/Splunk/6.2.5/Viz/Savedsearches#Post-process_searches
- Chaining for multiple post-process searches is not currently supported for SimpleXML dashboards.
- If the base search is a non-transforming search, the Splunk platform retains only the first 500,000 events returned. The post-process search does not process events in excess of this 500,000 event limit, silently ignoring them. This results in incomplete data for the post-process search. A transforming search as the base search helps avoid reaching the 500,000 event limitation.
- If the post-processing operation takes too long, it can exceed Splunk Web client’s non-configurable timeout value of 30 seconds. This can result in a timeout due to an unresponsive splunkd daemon/service. This scenario typically happens when you use a non-transforming search as the base .
Examples of the Basic Concepts
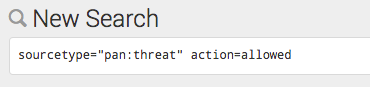
Splunk Search with non-transforming commands returning RAW results:
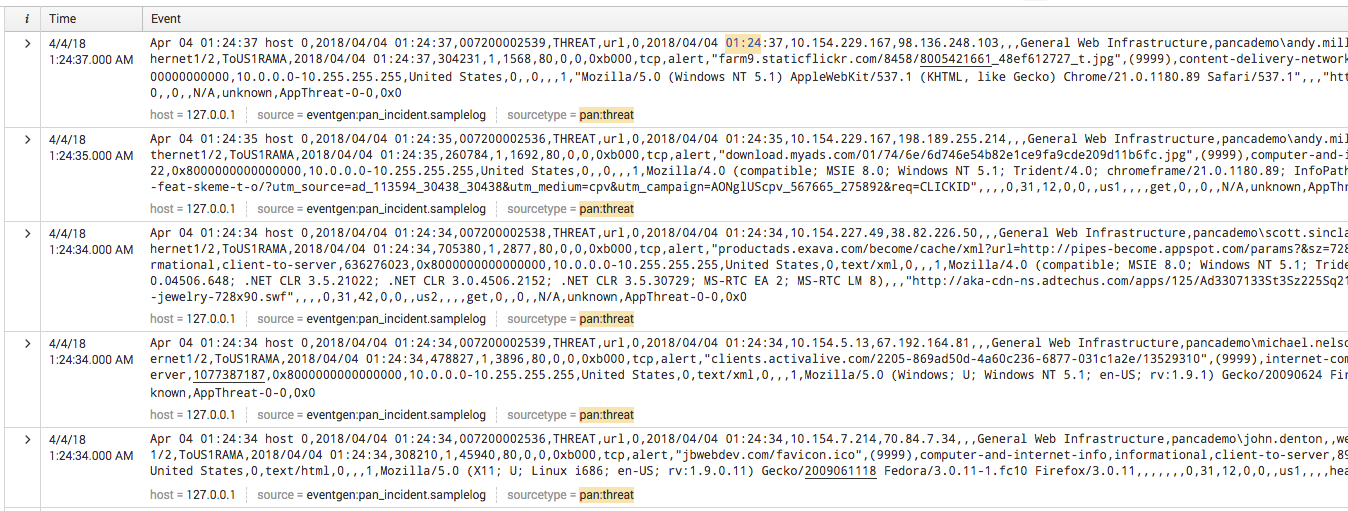
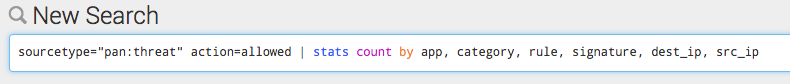
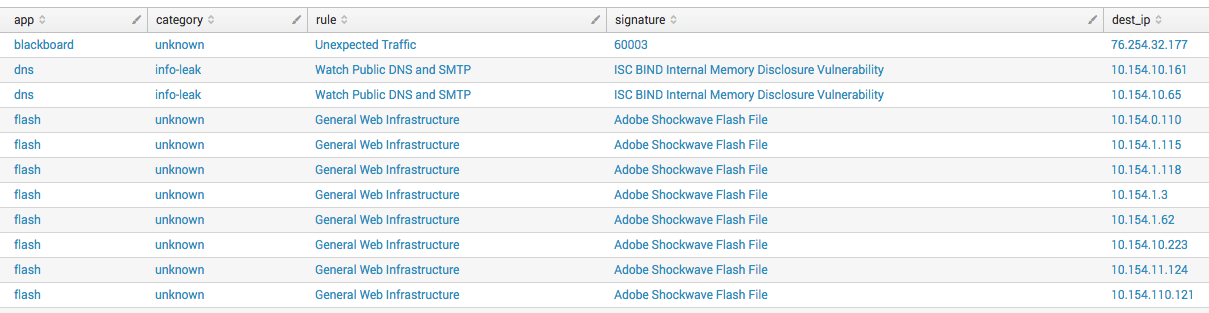
Splunk Search with transforming command retuning transformed results:
Examples of Post-process
There are many different ways to determine what should be the base search and what should be in each post-process search. One method is to create all of the queries for your dashboard first and then find the beginning commonality between the searches which will end up being your base search. Then the part that does not meet the commonality will then be the post-process searches. Keep in mind that if you have four Splunk queries and three have a commonality but the fourth is completely different, you can do the base search for the three common Splunk queries and the fourth will just run as a normal query.
We will take the following 5 Splunk queries as our example for what we have determined to put into our new dashboard. If you just ran these in our dashboard it would run 5 almost identical queries taking up valuable search resources and user limits.
| sourcetype=”pan:threat” action=allowed | stats count by app |
| sourcetype=”pan:threat” action=allowed | stats count by rule |
| sourcetype=”pan:threat” action=allowed | stats count by category |
| sourcetype=”pan:threat” action=allowed | stats count by signature |
| sourcetype=”pan:threat” action=allowed | stats count, values(rule) as rule by dest_ip |
As we can easily see, the commonality of the 5 queries is going to be:
| sourcetype=”pan:threat” action=allowed | |
The issue with just taking that portion as your base search is that it will return RAW results. If we review the 5 queries, they are using 5 different fields which means our transforming base search should include all 5 fields.
| sourcetype=”pan:threat” action=allowed | stats count by app, category, rule, signature, dest_ip, src_ip |
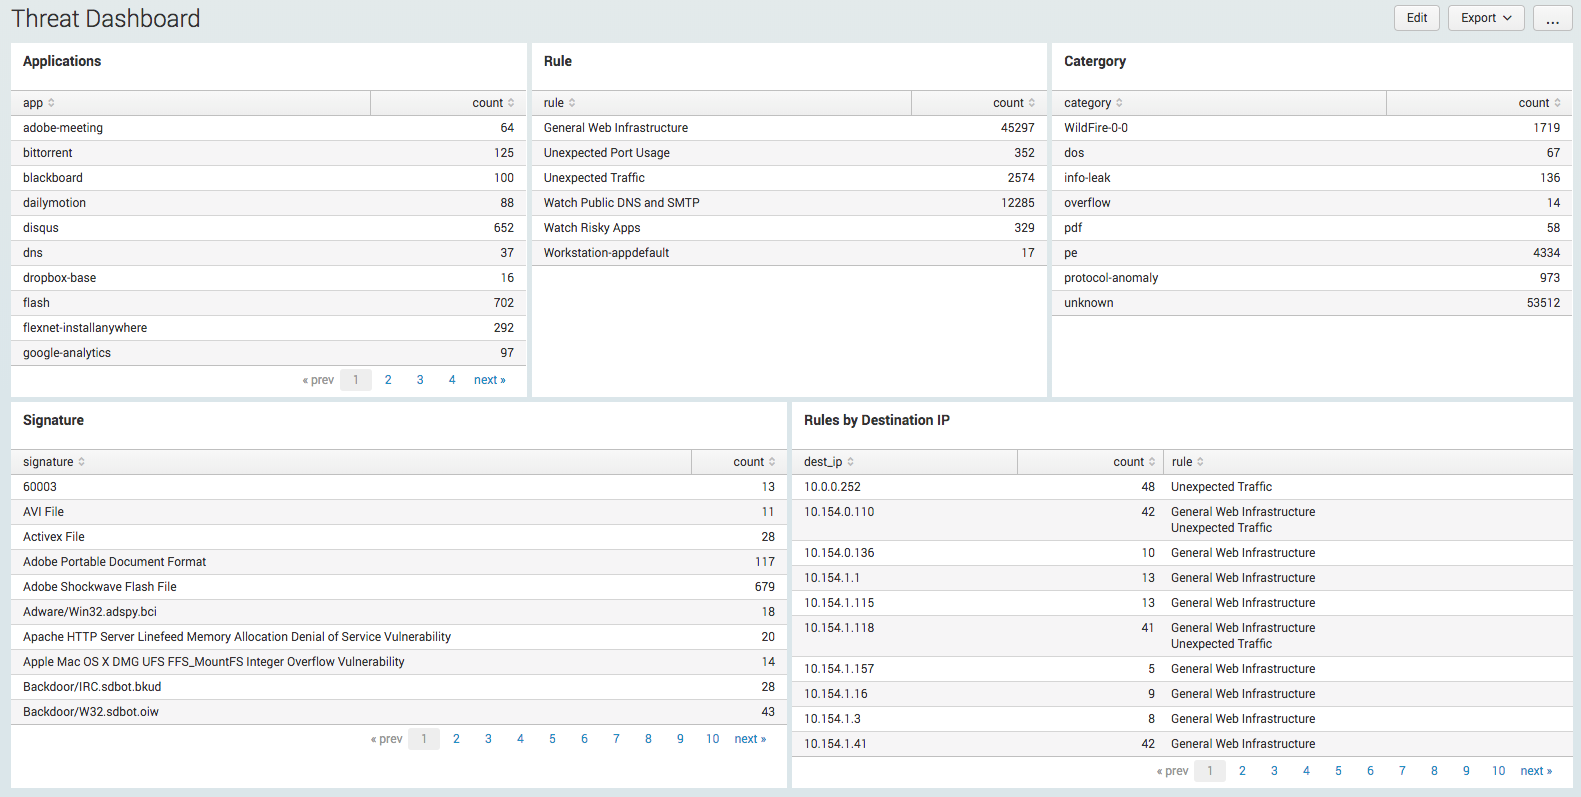
If we continue our method of initially creating our dashboard with our 5 independent queries:
Then we can switch to the XML source view of the dashboard and start making our base search and post-process searches. Below is how the dashboard’s XML looks before using any post-process searches.
| < <panel> <table> <title>Applications</title> <search> <query>sourcetype=”pan:threat” action=allowed | stats count by app</query> <earliest>-24h@h</earliest> <latest>now</latest> </search> <option name=”drilldown”>none</option> </table> </panel> <panel> <table> <title>Rule</title> <search> <query>sourcetype=”pan:threat” action=allowed | stats count by rule</query> <earliest>-24h@h</earliest> <latest>now</latest> </search> <option name=”drilldown”>none</option> </table> </panel> <panel> <table> <title>Catergory</title> <search> <query>sourcetype=”pan:threat” action=allowed | stats count by category</query> <earliest>-24h@h</earliest> <latest>now</latest> </search> <option name=”drilldown”>none</option> </table> </panel> </row> <row> <panel> <table> <title>Signature</title> <search> <query>sourcetype=”pan:threat” action=allowed | stats count by signature</query> <earliest>-24h@h</earliest> <latest>now</latest> </search> <option name=”drilldown”>none</option> </table> </panel> <panel> <table> <title>Rules by Destination IP</title> <search> <query>sourcetype=”pan:threat” action=allowed | stats count, values(rule) as rule by dest_ip</query> <earliest>-24h@h</earliest> <latest>now</latest> </search> <option name=”drilldown”>none</option> </table> </panel> </row> </dashboard> |
We will create our base search with the following:
| Base Search | sourcetype=”pan:threat” action=allowed | stats count by app, category, rule, signature, dest_ip, src_ip |
| Post-process 1 | | stats sum(count) as count by app |
| Post-process 2 | | stats sum(count) as count by rule |
| Post-process 3 | | stats sum(count) as count by category |
| Post-process 4 | | stats sum(count) as count by signature |
| Post-process 5 | | stats sum(count) as count, values(rule) as rule by dest_ip |
Once in the XML Source view, create your base search at the top, under the label but before the first row:
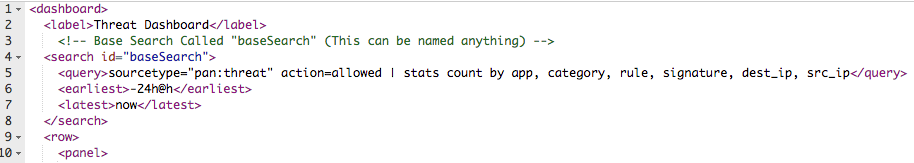
The base search id can be named anything (in this case it is “baseSearch”) but it is best to make it something easy because you will need to use it throughout the dashboard. The base search id is referenced in each post-process search which appends the base search in front of each post-process search. To create the base search, the id is placed inside of the search tags at the top of the dashboard before all of the panels.
<search id=”{id name}”>
The id name must be in double quotes “” and the name is case sensitive. Next, the transforming base search query is added inside of the open and closed query tags
<query> {insert query here} </query>
After the query tags, any other supported tags can be used such as the timeframe tags including tokens created and assigned in the dashboard. Then close the search tag.
</search>
Next we will add the post-process searches to each of the panels on the dashboard. The time references should be removed since the base search controls the timeframe:
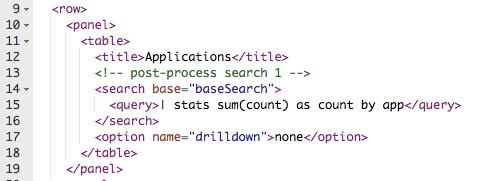
Similarly to the base search, the post-process search uses the base search id in the search tags.
<search base=”{id name of base search}”>
Next would be the query tags where the post-process search goes. This query should start with a pipe “|” because it will be appended to the base search like it was all one query.
<query> “ {post-process search that start with a pipe “|” } </query>
After the query tags, any other supported tags can be used except the timeframe tags since the post-process searches go off the timeframe of the base search. Then close the search tag.
</search>
After modifying all 5 of the post-process searches in the XML source, the dashboard will be ready to use the base search. If you run the dashboard and look at the current searches, there will only be 1 search compared to 5 searches. Below is how the dashboard’s XML looks after making the changes.
| <dashboard> <label>Threat Dashboard</label> <!– Base Search Called “baseSearch” (This can be named anything) –> <search id=”baseSearch”> <query>sourcetype=”pan:threat” action=allowed | stats count by app, category, rule, signature, dest_ip, src_ip</query> <earliest>-24h@h</earliest> <latest>now</latest> </search> <row> <panel> <table> <title>Applications</title> <!– post-process search 1 –> <search base=”baseSearch”> <query>| stats sum(count) as count by app</query> </search> <option name=”drilldown”>none</option> </table> </panel> <panel> <table> <title>Rule</title> <!– post-process search 2 –> <search base=”baseSearch”> <query>| stats sum(count) as count by rule</query> </search> <option name=”drilldown”>none</option> </table> </panel> <panel> <table> <title>Catergory</title> <!– post-process search 3 –> <search base=”baseSearch”> <query>| stats sum(count) as count by category</query> </search> <option name=”drilldown”>none</option> </table> </panel> </row> <row> <panel> <table> <title>Signature</title> <!– post-process search 4 –> <search base=”baseSearch”> <query>| stats sum(count) as count by signature</query> </search> <option name=”drilldown”>none</option> </table> </panel> <panel> <table> <title>Rules by Destination IP</title> <!– post-process search 5 –> <search base=”baseSearch”> <query>| stats sum(count) as count, values(rule) as rule by dest_ip</query> </search> <option name=”drilldown”>none</option> </table> </panel> </row> </dashboard> |
The use of post-process searches in dashboards might not always work if there are no common queries. In the situations where there is commonality, then post-process searches should be used. This is not only to reduce the work load that each query requires but it reduces the likeliness off users reaching their search limits especially if the dashboard has a large number of common panels.
Want to learn more about optimizing Splunk dashboards? Contact us today!
[pardot-form id=”16215″ title=”Blog – Josh Grissom – Optimizing Splunk Dashboards with Post-process Searches”]