
Step by Step Guide to Installing Splunk Insights for Infrastructure
Step by Step Guide to Installing Splunk Insights for Infrastructure
By: Pete Chen | Splunk Consultant
Overview
Since the release of Splunk Insights for Infrastructure, I’ve heard a few people tried to install it, and have had some challenges along the way. There are some pre-requisites before starting a successful installation, which will be covered in this blog. We’ll talk a little about what Insights for Infrastructure is, installing the home instance, and installing remote instances.
Before we go any further, the environment I used in my installation consisted of:
1 x Home Instance
1 virtual CPU
8 GB RAM
128 GB HD
1 x Remote Instance
1 virtual CPU
4 GB RAM
80 GB HD
Both servers are virtual, with Microsoft Hyper-V as the hypervisor. The OS used for the servers is CentOS 7 (x86_64). Using the .iso from CentOS, the servers are installed as bare minimum servers.
What is Splunk Insights for Infrastructure?
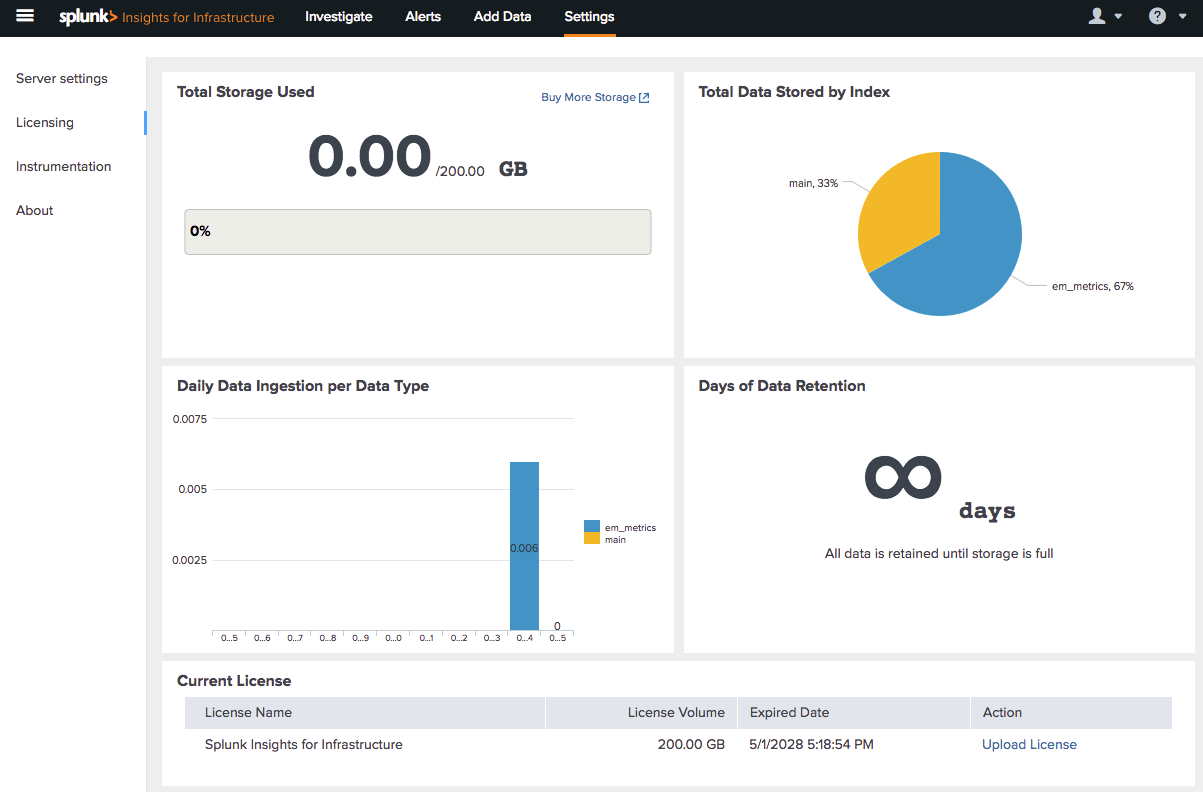
Splunk Insights for Infrastructure is a new product offering from Splunk, which aims to provide a faster and easier way to gain insight into collecting monitoring data from servers in a technical infrastructure. While traditional Splunk offers licenses based on daily ingestion rate, Splunk Insights for Infrastructure pricing is based on Storage (GB) per month. And if that wasn’t enough to get you excited, the first 200GB is FREE!
At the present time, the only operating systems supported by Splunk Insights for Infrastructure are Red Hat Enterprise Linux 6 2.6.32+
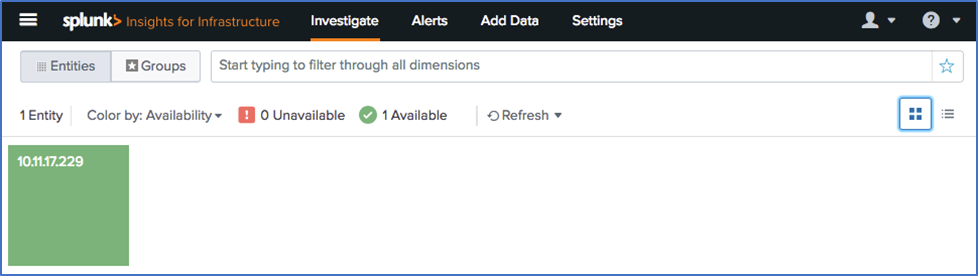
After logging in, this is the grid view of the entities being monitored. The blocks are color-coded based on health. The server being monitored in this example is healthy.

Installing Splunk Insights for Infrastructure Base
From a base installation of CentOS 7, this is a description of the steps needed to complete the task. Please keep in mind that this guide uses a .tgz installation (compared to rpm, deb, or, dmg). Using a different version of Linux may change the commands used below.
Step-by-Step
Step 1: Prepare the server for Splunk by disabling the firewall service. By default, firewalld is enabled, which may block access to port 22 (ssh), 8000 (web access), and 8089 (Splunk Admin Port). The first command listed in this step stops the firewall service. The second step turns the service off for future restarts.
Step 2: SELinux is “Security-Enhanced” Linux. While this is helpful to secure a server, it interferes with the operations of Splunk Insights for Infrastructure. To disable this, use any text editor to change the SELinux configuration file. Change the value from “SELINUX=enforcing” to “SELINUX=disabled”.
Step 3: Updating the server libraries and applications is never a bad idea. Installing updates can provide better security and add newer features and capabilities. This is not a required step.
Step 4: WGET allows a server to download an application from the web. This will help in downloading the software on the base server. On the remote servers, using a script to install monitoring services will also require WGET.
Step 5: EPEL stands for “Extra Packages for Enterprise Linux”. The additional packages don’t conflict with existing standard Linux packages, and can add more functionality to the server. CollectD is a package found in EPEL (and not in standard Enterprise Linux) and will be necessary to configure remote servers for monitoring. Since it’s helpful to monitor the performance of the base server as well, this should be installed.
Step 6: CollectD is a background process which collects, transfers, and stores performance data of the server. This data is the foundation of Splunk Insights for Infrastructure and determines the health of a server. Once CollectD is installed, the data collected will be sent to the base server via Splunk Universal Forwarder.
At this point, the prerequisite work is complete, and the server is ready to download and install Splunk Insights for Infrastructure.
Step 7: Use WGET to download the installation tar file directly to the server. The alternative is downloading the software locally, then having to find a way to transfer the installation file to the server. Using WGET makes it much simpler.
Step 8: To install Splunk, copy the installation file into the folder /opt. This will require root permissions. Once the file is copied, enter the command “tar -vxzf” followed by the file name. Tar is the application used to decompress the installation file. The subsequent letters also have value. V stands for Verbose. Z tells the application to decompress the file. X tells the application to extract the files. F tells the application a file name will be specified. Depending on how your Splunk user is set up, this may require root permissions.
Step 9: This step is a precautionary step. Changing the ownership of the Splunk folder will ensure the Splunk user can run the software without permission concerns. The R makes the change recursive, so subordinate directories will also have their permissions changed. “splunk:splunk” changes the owner of folders to the user “splunk” (first), within the group “splunk” (second). This will need to be run as root.
Step 10: This is the standard Splunk start command. The first time Splunk is run, there will be a requirement to read through and accept the software license agreement. To skip this and accept the license automatically, use “–accept-license”. This command assumes Splunk was installed in the /opt folder.
Step 11: Servers can restart for many reasons. If an application is not configured to run on start, it will have to be manually restarted after the server is back online. Running the “enable boot-start” creates an init script, which is used to start Splunk as the server is starting up.
Now, Splunk is set up, and should be accessible through a web browser by going to the site https://<hostname>:8000. When going to the URL, if a security certificate is not properly set (which it isn’t in this case), there will be a warning about the site not being secure. Advancing to the site is safe.
Installing Splunk Insights for Infrastructure Remote
Much like the installation of the base Insights for Infrastructure server, there are a few assumptions made in this document for the installation of remote services. This document will detail steps taken for a CentOS 7 server. The remote nature of the server simply means a different server, gathering its own metrics, and sending them to the base server for analysis. The prerequisite steps are the same as above.
Step by Step
Step 1: Prepare the server for Splunk by disabling the firewall service. By default, firewalld is enabled, which may block access to port 8089 (Splunk Admin Port). The first command listed in this step stops the firewall service. The second step turns the service off for future restarts.
Step 2: SELinux is “Security-Enhanced” Linux. While this is helpful to secure a server, it interferes with the operations of Splunk Insights for Infrastructure. To disable this, use any text editor to change the SELinux configuration file. Change the value from “SELINUX=enforcing” to “SELINUX=disabled”.
Step 3: Updating the server libraries and applications is never a bad idea. Installing updates can provide better security and add newer features and capabilities. This is not a required step.
Step 4: WGET allows a server to download an application from the web. This will help in downloading the software on the remote servers, using a script to install monitoring services will also require WGET.
Step 5: EPEL stands for “Extra Packages for Enterprise Linux”. The additional packages don’t conflict with existing standard Linux packages, and can add more functionality to the server. CollectD is a package found in EPEL (and not in standard Enterprise Linux) and will be necessary to configure remote servers for monitoring.
Step 6: CollectD is a background process which collects, transfers, and stores performance data of the server. This data is the foundation of Insights for Infrastructure and determines the health of a server. Once CollectD is installed, the data collected will be sent to the base server via Splunk Universal Forwarder.
Step 7: Run the installation script found in the configuration page of the Splunk Insights for Infrastructure base. In this document, the default script will be used. In a production environment, key-value pairs can be added for troubleshooting, analysis, and filtering hosts. This will need to be run as root on the remote server.
Step 8: Once the script is run, a Collectd folder will be created in /opt. Browse to /opt/collectd/etc and modify collectd.conf. By default, core server metrics should be enabled.
At this point, the remote server should start aggregating metrics into Collectd, and sent to the base server through Splunk Universal Forwarder. Within a few minutes, data should start to appear on Insights for Infrastructure.
If you have questions or need further help installing SII, please contact us today:
[pardot-form id=”15664″ title=”Blog- Pete Chen – Step by Step Guide to Installing Splunk Insights for Infrastructure”]