
Machine Learning with Splunk: Fitting a Model
What is machine learning? A quick search online will return definitions using the words algorithm, statistics and model. A slightly less technical definition would be that machine learning is a general term used for formulas to determine outcomes based on features from provided data. If the goal was to classify plants, for example, height, petal color and environment might all be features in the data set.
The objective for today will be to learn how to fit a model using Splunk’s Machine Learning Toolkit. We will be using data from the passenger list of the Titanic to fit a model to predict who survived. The data set can be found at https://www.kaggle.com/c/titanic/data. The training set is what will be used to build and validate our model.
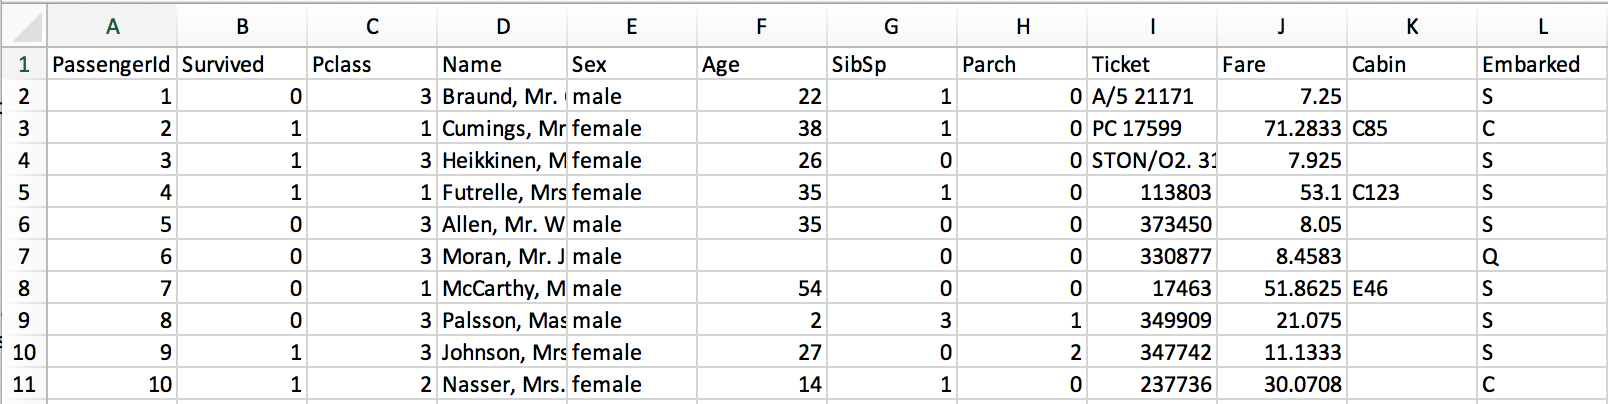
The data set contains the features passenger ID (PassengerId), passenger class (Pclass), the name of the passenger (Name), the sex of the passenger (Sex), the age of the passenger (Age), the number of siblings and spouses on board with the passenger (SibSp), the number of parents on board with the passenger (Parch), the passenger’s ticket number (Ticket), the amount of the passenger’s fare (Fare), the passengers cabin number (Cabin), and the port the passenger embarked from (Embarked). The training set also has the additional feature of Survived.
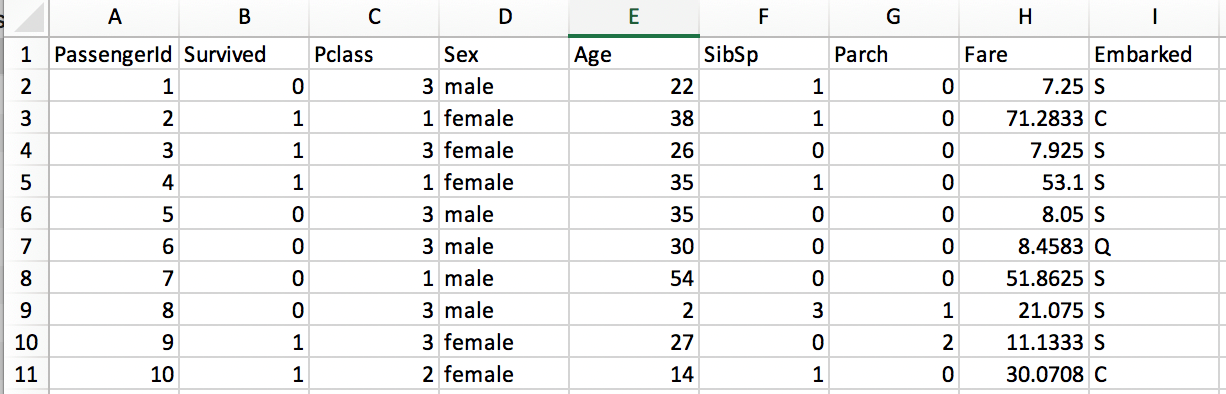
Now that the data has been gathered the first step is to clean the data or in other words to make the data as complete and useful as possible. Not all features are useful; a good first step is to remove features that have no predictive value. It is better to leave features than to remove them before determining the predictive capabilities, but features that always have a unique entry such as ticket and name can be removed. (PassengerId will remain as the identifier for each entry.) There are a couple of options with Cabin; it can either be removed or turned into a binary feature. In this case the binary would be zero (0) for no cabin and a one (1) if a cabin is listed. For simplicity this feature will be removed as well due to a lack of information.
The next step involves dealing with data that is not complete but too important to remove. The age feature is not complete but due to “women and children first” age will most likely be a strong predictor in who survives. One option is to remove all entries missing the feature. While not a majority of the entries, a significant number are missing age and removing them may impact the predictive capabilities of other features.
A better option would be to insert a value that has little to no effect on the age feature and allows for the predictive potential from the other features to be used in the model. Setting an age too low will imply the passenger is a child; setting it too high may not be accurate either. The best option is to fill the blanks with the average age of all the passenger given. This should minimize any effects filling the blanks will have and allow the entries to remain in the data set. The average age for the data set is just under 30. Since age is counted in whole numbers the blank ages will be replaced with 30.
Now that the data has been cleaned it is time to begin using Splunk to build our model! Load the train.csv file into Splunk (it won’t have a timestamp so don’t worry about that) and then click on the Machine Learning Toolkit app. Once inside the app go to experiments and click on create new experiment and select predict categorical fields (since survivor is a category with only two possible values of one (1) or zero (0)). Name the experiment anything you like.

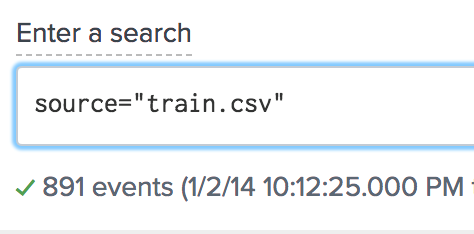
In the search field enter “source=train.csv”. The results should be 891 events. Select “logistic regression” for Algorithm, “survived” in field to predict, and set the split for training/test to 80/20. The split will allow for 80 percent of the data to be used to fit the model and 20 percent to be used to validate the model. The split is randomized from the 891 entries of the entire data set.
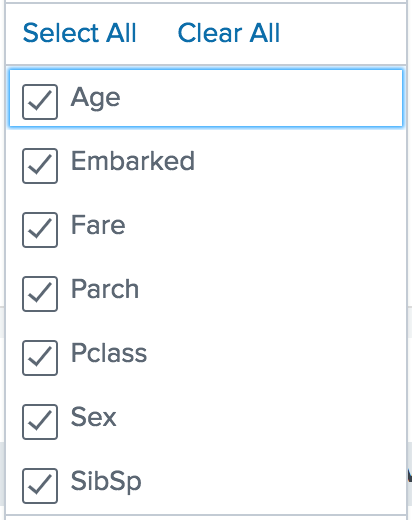
The final step in building this model is feature selection. Begin by selecting all the features except passengerId in the fields to use for predicting as shown below.
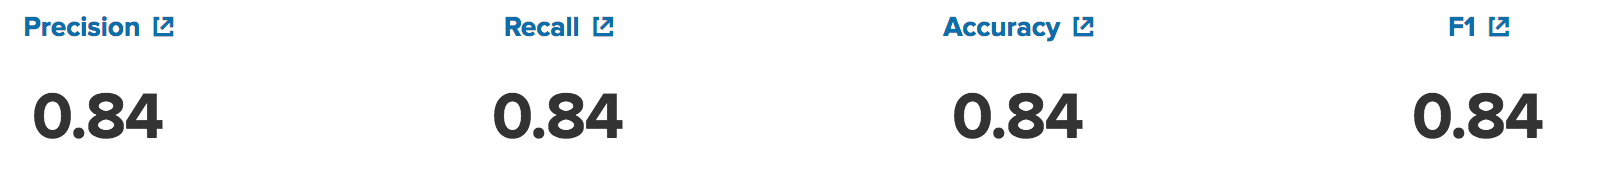
Depending on how the 80/20 split is done your results will vary but most likely it will be somewhere around 75 percent. 75 percent is better than what is expecting from guessing (50 percent), but the model can be improved. Unselect Embarked from the fields to use for predicting and fit the model again. The model should now be in the high 70’s to low 80’s. The terms precision and recall measure the accuracy of the model. Precision is the percentage of returned values that were accurate and recall is the percentage of accurate values that were returned. In this scenario precision and recall are the same. In the experiment history previous setting can be loaded and earlier models can be fit again allowing for several variations of the same model without needing different experiments.
The Splunk Machine Learning Toolkit is a powerful toolkit with the potential to take your data to the next step from descriptive to predictive. The Machine Learning Toolkit, however, is just that – a tool. Loading data into the MLT or knowing Splunk are not enough. Understanding how to clean and wrangle data to have the most predictive impact is necessary as well.
Want to learn more about machine learning with Splunk? Contact us today!
[pardot-form id=”16985″ title=”Blog – Abe Hardy – Machine Learning with Splunk: Fitting a Model”]