
Splunk Indexer Cluster Run Times
By: Aaron Dobrzeniecki | Senior Splunk Consultant
Have you ever wondered how you can check your indexer cluster run times are performing? Of course, there are a multitude of dashboards and statistics you can pull from the Monitoring Console to use to show the health of your indexer cluster run times. While working on a project for one of our large Splunk customers, my colleague, Antonio Patinonoguez, and I produced the idea to create a simple synthetic search for each of our indexer clusters. From these saved searches, we can pull out the total_run_time each time the searches run and find the indexer cluster run time each time the search runs. Below are the details:
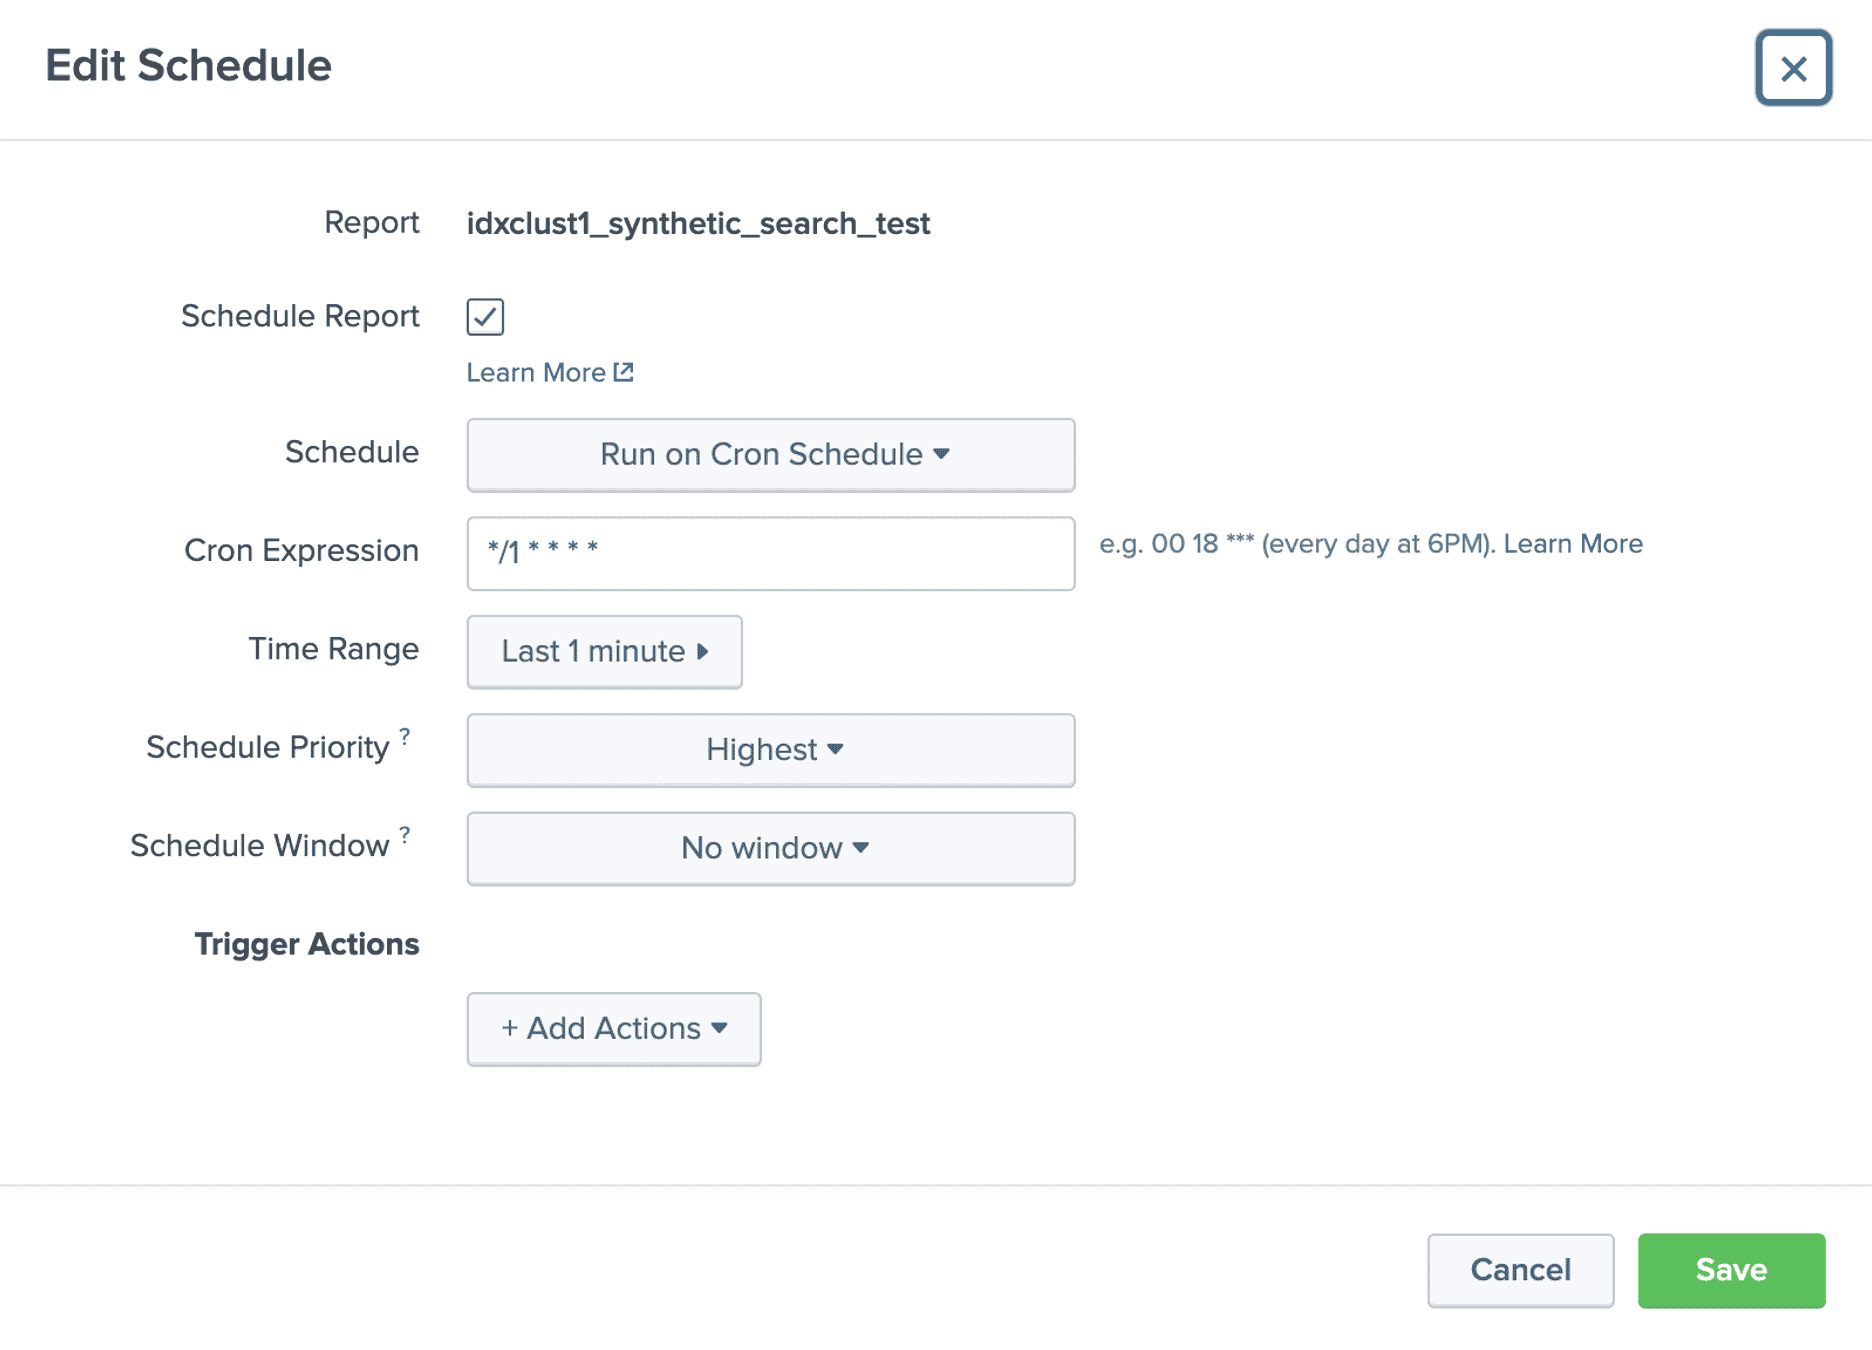
Let us say for example your environment has 3 different indexer clusters and we want to see the run time for our synthetic searches over time to see when we receive extremely high spikes in run time. You will create a saved scheduled search that runs every minute looking back 1 minute. Please see the simple search below:
**NOTE** You need to have your splunk_server match your indexers naming format. index=_internal splunk_server=*idx1_cluster* lhead 100
You can create a scheduled search for each of your indexer clusters or if you have one cluster, you can create it for each indexer. This is just a simple search, searching the internal logs that were indexed on the indexer cluster, returning the first 100 events.
Once enough time has passed (maybe a few days of collecting metrics), you can take the below search and see your synthetic search run times over X amount of time in the past. The run times are stored in the _audit index which will keep data for 30 days by default. Please see the screenshots below of the current searches we have set up in this environment.
index=_audit savedsearch_name IN (“idxclust1_synthetic_search_test”, “idxclust2_synthetic_search_test”, “idxclust3_synthetic_search_test”) | stats latest(total_run_time) by savedsearch_name
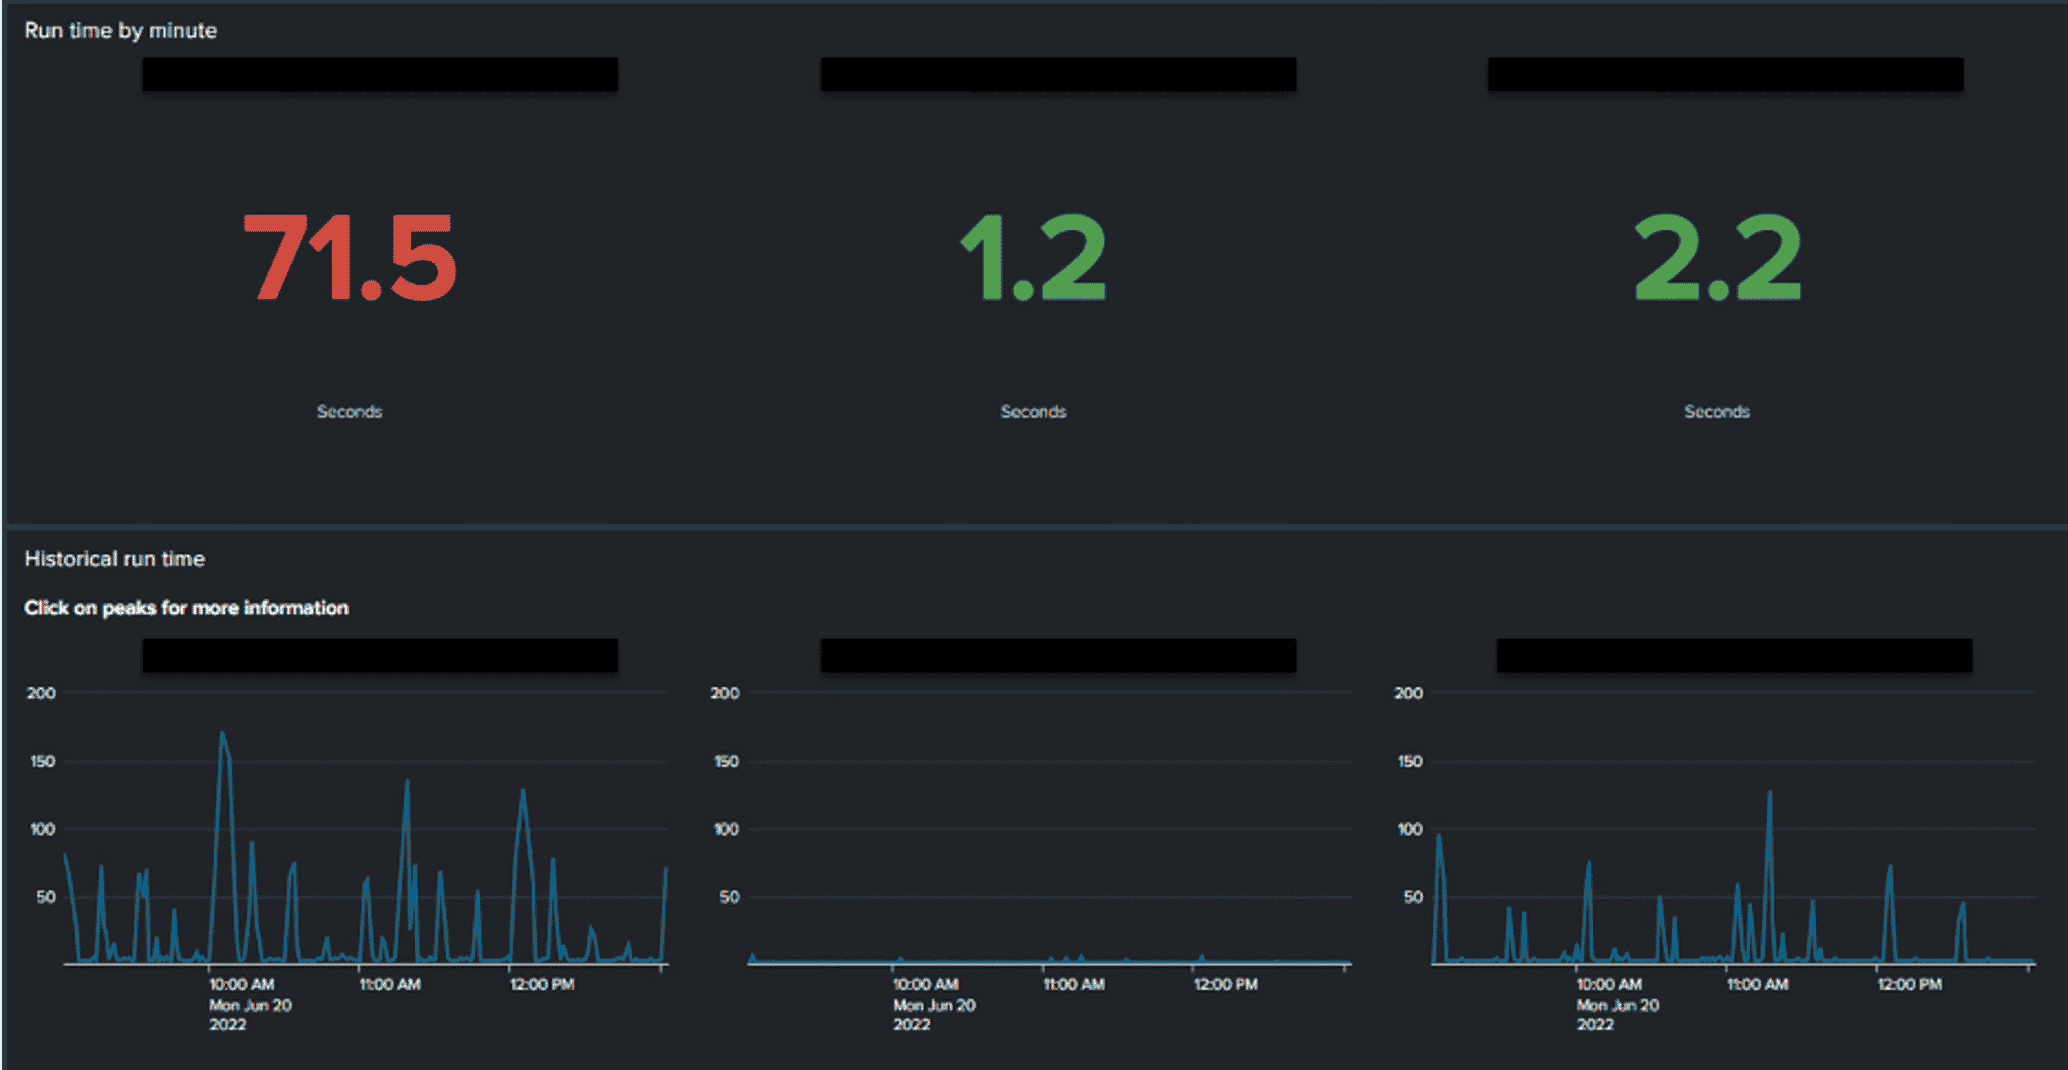
With our help, you can also build a dashboard as shown in the screenshot below. The top panel is the following search, this gives us the absolute latest run time for our scheduled synthetic search in seconds. As you can see, indexer cluster 1 has an exceedingly high run time for our synthetic search at 71.5 seconds. For one simple search like we have for this, the desired results are what cluster 2 and 3 are currently at. We do not want high run times.
What might cause high run times you ask? There could be an exceptionally LARGE number of searches stemming from that certain indexer cluster causing extreme amounts of CPU usage. There could also be long-running or bad searches that are taking up too much memory. Numerous issues could be the cause of high run times.
The top panel in this screenshot is the search below, there is a total_run_time field that pulls out the total time it took the synthetic search to run. Having a low search run time can show that your indexers are processing searches in a healthy manor.
The second panel in this screenshot is the timechart of the last X amount of time in the past. We have added a time-picker to our dashboard for this.
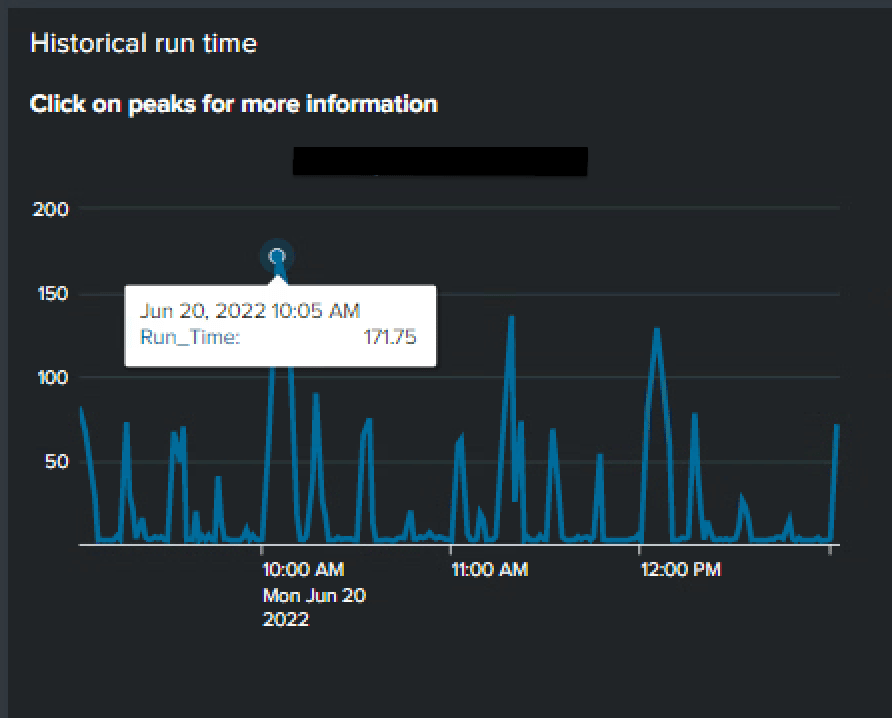
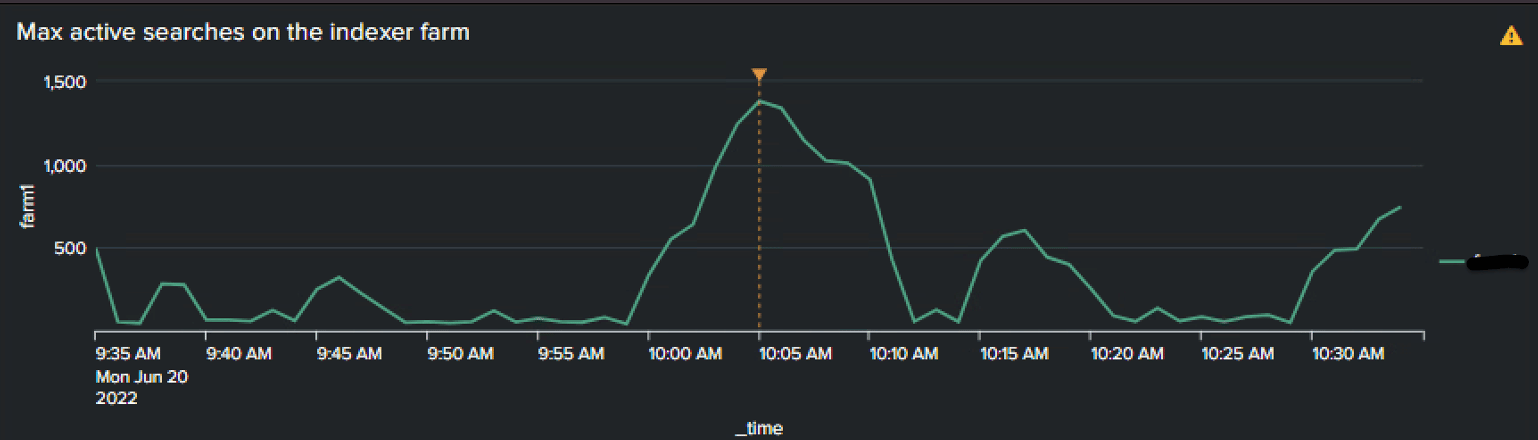
This dashboard we created helps us dig into and troubleshoot when indexer clusters have high synthetic search run times. In the screenshot below you will see my mouse on the largest point on the graph for indexer cluster 1. By clicking on this point, we open two more panels that show:
1. Thirty minutes before and after where I clicked on the graph (with a dotted line showing where I clicked); the max historical searches by search head cluster/search heads in the environment.
2. Thirty minutes before and after where I clicked on the graph (with a dotted line showing where I clicked); the max active searches on that specific indexer cluster.
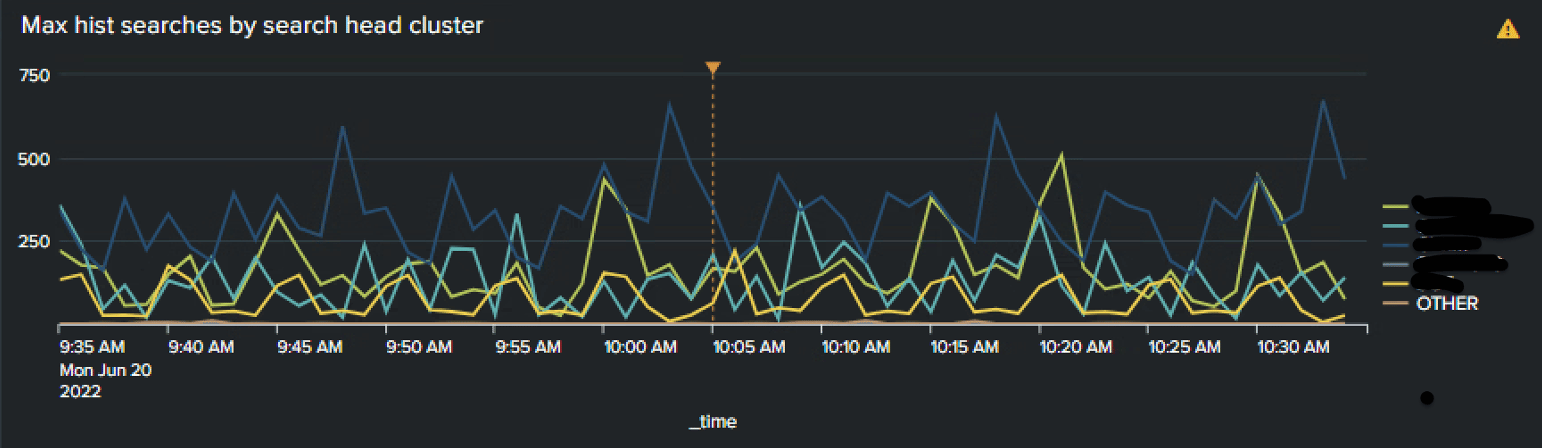
From these two panels, you can click on any point on either panel which will open a separate dashboard related to the panel you clicked. This dashboard is interactive and provides a LOT of vital information regarding how well your indexer clusters/indexers are performing, as well as ALL the long-running searches happening on a specific search head clusters (Just by clicking a point on the max hist searches by search head cluster panel!). For more help Wrangling your Splunk indexers check out this blog.
For more information about our incredible Indexer Cluster Metrics dashboard, please reach out to the TekStream Solutions Splunk team!