

Troubleshooting In Splunk
By: David Allen | Senior Splunk Consultant
Like many things in life, having the right tools to fix a problem is what separates the novice from the expert. The novice has almost no tools in their toolbox, and the tools that they have are large and clunky. Whereas the expert has many tools which have been refined over many years of experience fixing many problems. Without the correct tools for the job, many tasks simply could not be accomplished — or at least would become much more difficult and time-consuming. Understanding what tools are available to fix and troubleshoot common Splunk Enterprise problems and how to use those tools — at a macro level — is the purpose of this blog.
The first tool need you will as you begin your Splunk troubleshooting journey is some basic knowledge on how to troubleshoot and how to narrow down all the possibilities, like peeling off layers of an onion until eventually you find the root cause of the problem. Some problems we see over and over and have learned to do a couple of simple checks to solve the problem. How many times have you run a search and said to yourself, “Where are all my fields?” We quickly learned to check the search modem and make sure if you want fields to be in Verbose mode or to a lesser extent Smart mode.
Search Job Inspector
The first tool you will need for troubleshooting basic searching problems is the Splunk Search Job Inspector. If you suspect that your search is not working properly, then using the Search Job Inspector may shed some light on the issue. The Search Job Inspector is a tool that lets you take a closer look at what your search is doing and see where the Splunk software is spending most of its time.
You can access the Job Inspector by clicking the dropdown to the left of the search mode.
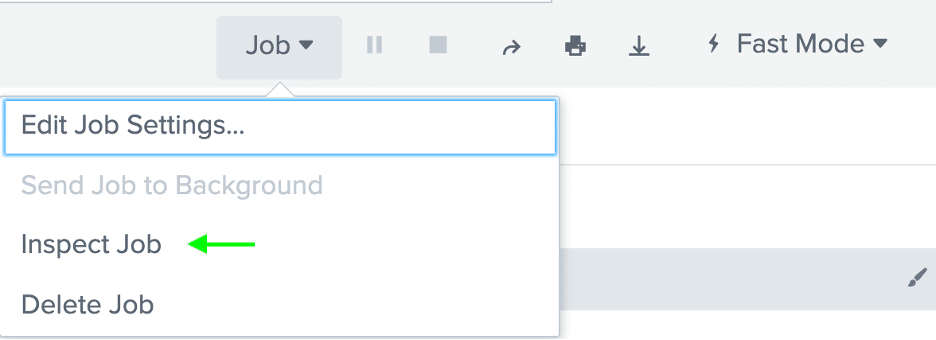
From the dropdown, select “Inspect Job.” You will see another screen containing Execution Costs details and Search Job Properties details. Also note the amount of time it took to complete the search, which may be a symptom of a problem you are not even aware of yet!
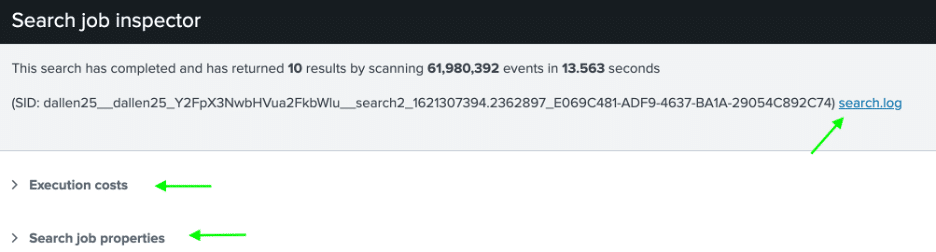
Execution Costs
The Execution Costs section lists information about the components of the search and how much impact each component has on the overall performance of the search.
- – The component durations in seconds.
- – How many times each component was invoked while the search ran.
- – The input and output event counts for each component.
With the information in the Execution Costs section, you can troubleshoot the efficiency of your search. You can narrow down which processing components are impacting the search performance.
Search Job Properties
The Search Job Properties section contains a list of many fields with additional search parameters. The most important fields for troubleshooting are the following:
- eventCount: The number of events returned by the search.
eventFieldCount: The number of fields found in the search results.
eventIsTruncated: Indicates that events have not been stored and not available for search.
isDone: Indicates if the search has completed.
isFailed: Indicates if there was a fatal error executing the search.
isFinalized: Indicates if the search was finalized (stopped before completion).
runDuration: Time in seconds that the search took to complete.
You also have access to the search.log link on the far right which opens the search.log where you can search for errors and warnings which may give a clue as to the search issue you are experiencing.
But for more complex SPL (Search Programming Language) problems, ask yourself some basic questions:
- – When did this start happening?
- – What is the exact thing I am searching for and what is the time range?
- – Have I added a lookup file or event type incorrectly?
Then remove lines of SPL and add them back one line at a time and find the line where the problem shows up. Then unravel the problematic line piece by piece until you find the problem.
The above example works fine for basic search problems, but for Enterprise problems, you are going to need some more powerful tools in your toolbox.
BTOOL
Splunk uses configuration files for almost all the settings within it. These .conf files are scattered all over the directory structure in many similarly-named .conf files. Splunk combines these similarly named files lexicographically and by a defined precedence order. To complicate things further, Splunk needs to be reset to reload the latest changes to the .conf files. If you think that Splunk is not using the configurations that it should, then BTOOL is your tool of choice.
BTOOL is a Splunk CLI command which shows what the actual settings are on the disk, or most likely SSD these days – not what is in memory and maybe not what Splunk is currently running, so beware of this subtle fact. To be sure you are seeing the config settings Splunk is actually running, you will need to restart Splunk. To access this command be sure to be at the Splunk home directory: $SPLUNK_HOME/bin.
BTOOL comes with Splunk Enterprise software, so no additional purchase, download, or installation is needed.
Below is the typical BTOOL command syntax (Note: All CLI commands in this document are typical for *nix OS):
./splunk btool list [options]
Here are some examples of the most common BTOOL commands:
To display all the merged settings of the various inputs.conf files, run this command:
./splunk btool inputs list –-debug
Or you may want to see all input configurations contained in the search app:
./splunk btool –app=search inputs list
Or you may want to see all props configurations set in the search app, and in what context they are set:
./splunk btool props list –app=search --debug
Lastly, you may want to find an input stanza for which you know name:
./splunk btool inputs list | grep splunktcp
Splunk Log Files
Under the hood, Splunk is running a lot of processes, from ingesting data to searching data and a lot more. All of these processes, and many of the steps in between, generate data that the Splunk software records into log files. Analyzing these log files can give clues to help solve your Splunk problem. The most common logs used for troubleshooting in Splunk are the internal logs located in: $SPLUNK_HOME/var/log. This path is monitored by default, and the contents are sent to various indexes based upon the type of log file. The most common internal indexes are _introspection, _internal, and _audit.
The _introspection index collects data about the impact of the Splunk software on the host system.
It specifically collects the OS resource usage for Splunk processes, which can be broken down by Splunk process and viewed by host-level, dynamic CPU utilization and paging information. This index also contains disk input-output usage statistics. This can be very useful in diagnosing Splunk performance issues.
For example, use this search to find the median CPU usage of the main Splunkd process for one host over the last hour:
index=_introspection component=PerProcess host= data.process=splunkd

data.args="-p * start" OR data.args="service") earliest=-1h

| timechart median(data.pct_cpu) as cpu_usage(%)
_internal: This index includes Splunk Enterprise internal logs. This index can be used to check the flow of data through the various pipeline processes, data about license usage, the search scheduler, various Splunk crash logs, various search information, and more.
For instance, to search for the size of the search artifacts, use this search:
index=_internal sourcetype=splunkd_access method=GET jobs

|stats sum(bytes) by uri
The _audit indexes contain information about user activities such as failed or successful user log ins, modified settings, updated lookup files. Running searches, capability checks, and configuration changes generate audit events.
For example, to audit user access use this search:
index="_audit" action=log* action="login attempt"
One of the most common log files used for troubleshooting is the splunkd.log, which uses source type Splunkd and is indexed to the _internal index. The Splunkd source type is further broken down by component, so you can further refine your search by its subcategory. Using the source type Splunkd, you can use a search like this to check for any data quality warnings or errors:
index=_internal sourcetype=splunkd (component=AggregatorMiningProcessor OR

component=LineBreakingProcessor OR component=DateParserVerbose)

(log_level=WARN OR log_level=ERROR)
Or to check for potential index issues, you can use a search like this one:
index=_internal sourcetype=splunkd host=idx*.yourcompany.splunkcloud.com

component=metrics group=per_*_regex_cpu
Splunk generates many internal log files, and searching those internal logs is a good way to find or isolate many common Splunk Enterprise problems.
Health Report Manager – New in Splunk Version 8.0.0
The Health Report Manager is a high-level overview of your Enterprise and lets you view the status of various Splunk Enterprise components. Individual components report their health status every 30 seconds and results are displayed through a tree structure that provides a continuous, real-time view of the health of your deployment.
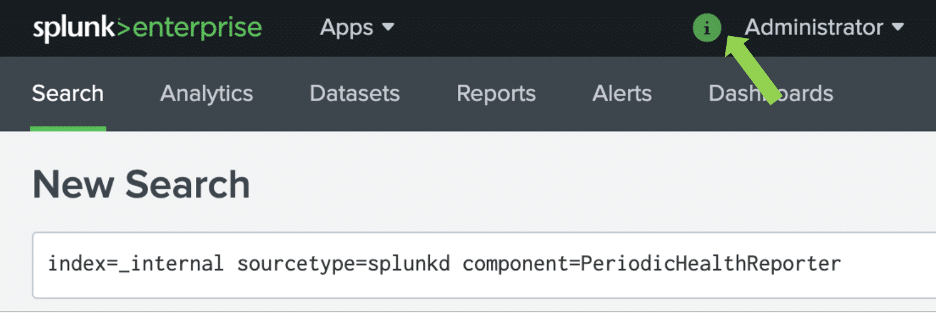
The Health Report Manager can be accessed here:
Once selected, the dropdown appears as shown below and displays the health of the various components. Check this if you suspect there may be an issue with your Enterprise or if the indicator is not green.
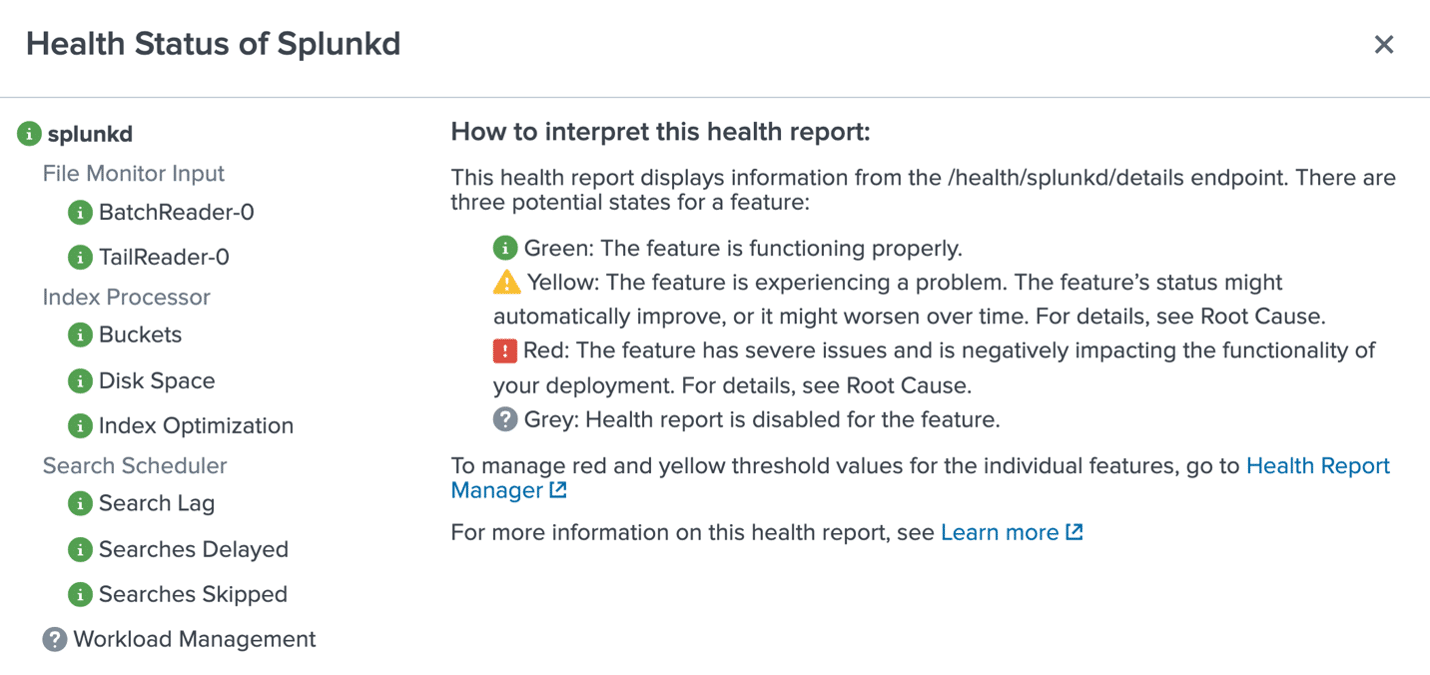
How the Splunk Health Report Works
The health report records the health status of Splunk features in a tree structure, where leaf nodes represent particular features, and intermediary nodes categorize the various features. Feature health status is color-coded in four states as follows:
- – Green: The feature is functioning properly.
- – Yellow: The feature is experiencing a problem.
- – Red: The feature has a severe issue and is negatively impacting the functionality of your deployment.
- – Grey: Health report is disabled for the feature.
Let’s run through a scenario of how we could find the problem if the Searches Skipped indicator is red.
- First, select the Searches Skipped feature to view diagnostic information about the current health status of the feature.
- Review the information under Root Cause. In this case, the percentage of high priority searches skipped is 44% over the last 24 hours, which exceeds the red threshold of 10% and causes the feature’s health status to change to red.
- Review the Last 50 Related Messages. These log entries include warning messages showing that some scheduled searches cannot be executed. For example:
09-15-2020 16:11:00.324 +0000 WARN SavedSplunker - cannot execute scheduled searches that live at the system level (need an app context).
One explanation for this type of warning message is the possibility that the number of high-priority searches running exceeds the maximum concurrent search limit, which can cause searches to be skipped.
After you review the root cause and log file information, which suggest that maximum search concurrency limits caused the Searches Skipped feature’s status change, you can use the Cloud Monitoring Console to check search scheduler activity and confirm if the suspected cause is correct.
- – In Splunk Web, click Apps > Cloud Monitoring Console.
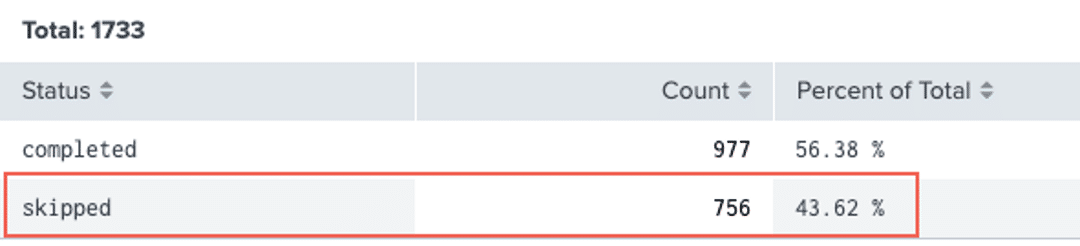
- – Click Search > Scheduler Activity. The Count of Scheduler Executions panel shows that 43.62 % of searches have been skipped over the last 4 hours, which approximates the percentage of skipped searches reported under root cause in the health report.

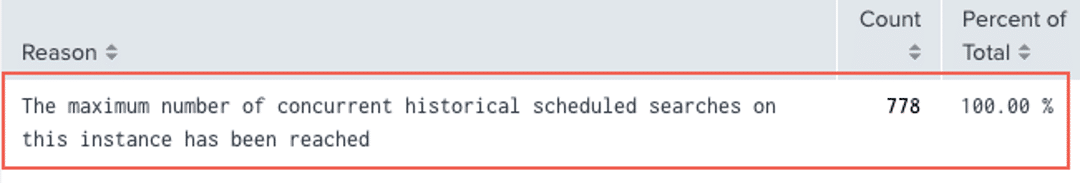
- – Click Search > Skipped Scheduled Searches. The Count of Skipped Scheduled Searches panel shows that 756 searches have been skipped over the last 4 hours because “the maximum number of concurrent historical searches on this instance has been reached.” This confirms that the cause of the Skipped Searches status change is that the maximum concurrent search limit has been reached on the system.

- – You can now take steps to remedy this issue by decreasing the total number of concurrent scheduled searches running and increasing the relative concurrency limit for scheduled searches, which can bring the number of concurrent searches below the maximum concurrent search limit, and return the Searches Skipped feature to the green state.
DIAG
A diag file provides a snapshot of the configurations and logs from the Splunk software along with select information about the platform instance. The diag collection process gathers information such as server specifications, operating system (OS) version, file system information, internal logs, configuration files, and current network connections. No customer data is included in the diag file.
In your troubleshooting quest using the CLI from the $SPLUNK_HOME/bin folder, run the following command for each instance that you are troubleshooting:
./splunk diag
If you do contact Splunk regarding an issue, they will often request a diag file for their analysis. You can even index the diag output file and “Splunk it” and create your own troubleshooting dashboards!
To generate and upload a diag, the CLI syntax is:
./splunk diag --upload
This command interactively prompts for values such as a Splunk username and password, choice of open cases for that user, and a description of the upload.
You can also remove certain components form the diag report with a command as follows:
./splunk diag -collect=
Likewise, components can be removed with this command:
./splunk diag -disable=
Using Telnet to Test Open Ports
When it comes to checking if a network port is opened or closed on a remote computer, there’s no easier way than to use Telnet. Ports that are left open for no reason are a security risk that can be exploited by malicious programs and viruses. At the same time, if a legitimate software communicates through a certain port, having that port closed will make the program throw errors and malfunction. Telnet allows the user to test individual ports and see whether they are open or not.
On a *nix OS box, you can run the Telnet command through the terminal as shown below:
telnet [domainname or ip] [port], e.g.>telnet 192.168.1.1 443
When a computer port is open a blank screen will show up, meaning that the connection has been successful. An unsuccessful connection will be accompanied by an error message.
Many times when you try to use Telnet, you may find that your own network is blocking your connection. It’s quite common for users to be running a firewall, which blocks connection to outbound ports. A basic way to test whether your firewall is interrupting your Telnet is to disable your firewall and run a Telnet test.
Network Toolkit
This is an app on Splunkbase. The Network Toolkit app provides a series of tools for troubleshooting networks. It includes tools for evaluating internet connection bandwidth, performing pings, traceroutes, DNS lookups, whois record checks, and waking sleeping computers (via wake-on-lan).
Additional Online Resources for Splunk Troubleshooting
The Splunk How-To YouTube Channel
Splunk Online Documentation
Online Troubleshooting Manual
Splunk Answers
Submitting a case to Splunk
Want to learn more about data model accelerations? Contact us today!