

The 3 Most Common Splunk Issues and How to Solve Them
By: Aaron Dobrzeniecki | Splunk Consultant
After working with hundreds of Splunk customers over the years, I have found that there are a few main issues that customers deal with on a daily basis. The three main issues I will be discussing today are troubleshooting issues with data quality (source types not parsing properly), issues with search performance, and finally, issues with high CPU and Memory usage.
Issue 1: Data Quality
One way to check if your data is being parsed properly is to search on it in Splunk. Provide Splunk with the index and sourcetype that your data source applies to. If you see that your data does not look like it was broken up into separate correct events, we have a problem.
Another way to check the quality of your data source is to run the below search in your environment. This is a modified version of a search from the Splunk Monitoring Console -> Indexing -> Inputs -> Data Quality. I have modified this search so that you can run this on any of your Splunk Search Heads.
index=_internal splunk_server=* source=*splunkd.log* splunk_server=* (log_level=ERROR OR log_level=WARN) (component=AggregatorMiningProcessor OR component=DateParserVerbose OR component=LineBreakingProcessor)
| rex field=event_message "Context: source(::|=)(?<context_source>[^\\|]*?)\\|host(::|=)(?<context_host>[^\\|]*?)\\|(?<context_sourcetype>[^\\|]*?)\\|"
| eval data_source=if((isnull(data_source) AND isnotnull(context_source)),context_source,data_source), data_host=if((isnull(data_host) AND isnotnull(context_host)),context_host,data_host), data_sourcetype=if((isnull(data_sourcetype) AND isnotnull(context_sourcetype)),context_sourcetype,data_sourcetype)
| stats count(eval(component=="LineBreakingProcessor" OR component=="DateParserVerbose" OR component=="AggregatorMiningProcessor")) as total_issues dc(data_host) AS "Host Count" dc(data_source) AS "Source Count" count(eval(component=="LineBreakingProcessor")) AS "Line Breaking Issues" count(eval(component=="DateParserVerbose")) AS "Timestamp Parsing Issues" count(eval(component=="AggregatorMiningProcessor")) AS "Aggregation Issues" by data_sourcetype
| sort - total_issues
| rename data_sourcetype as Sourcetype, total_issues as "Total Issues"
See the results of the search below:
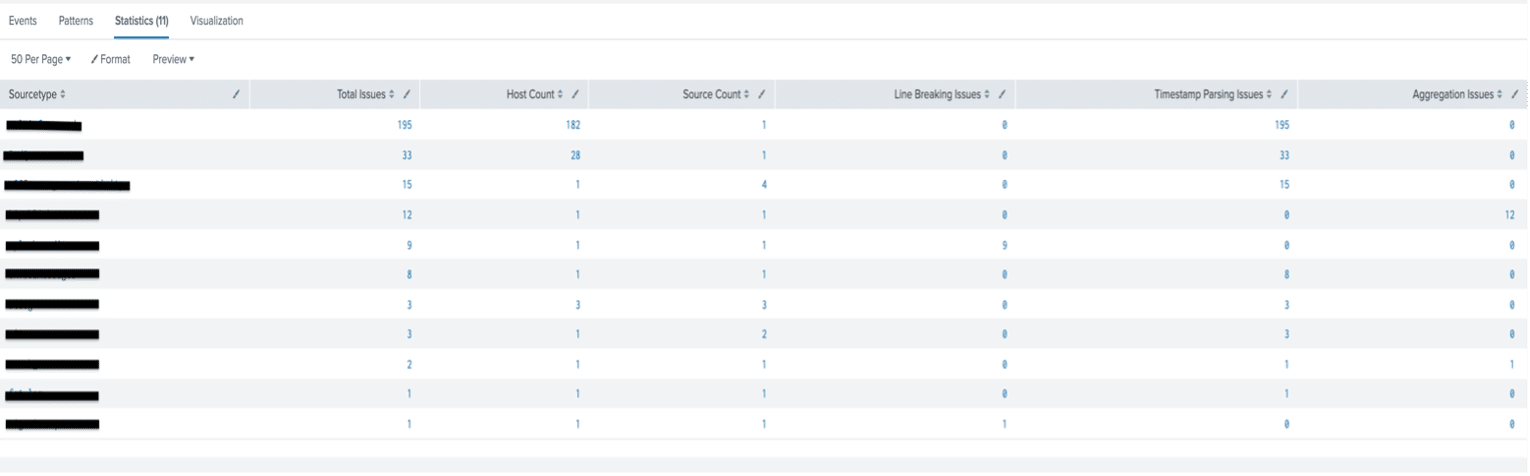
You will want to run the above search for at least the last 15 minutes. As you can see, it provides you with the number of Line Breaking issues, Timestamp Issues, and Aggregation Issues for each of your problematic sourcetypes. You can also drill down into the data by clicking on one of the numbers in the columns. In the screenshot below, you will see a warning for issues parsing a timestamp:
![]()
Taking the proper steps to make sure your data is correctly parsed correctly will make it a lot easier when working to get value out of your data. The most important step is testing the ingestion of your data in a test instance or environment before implementing in prod.
To correctly parse your data, you need the following 8 settings in props:
On your Splunk Enterprise Boxes:
- – LINE_BREAKER
- – SHOULD_LINEMERGE
- – MAX_TIMESTAMP_LOOKAHEAD
- – TRUNCATE
- – TIME_FORMAT
- – TIME_PREFIX
On the UF:
- – EVENT_BREAKER_ENABLE
- – EVENT_BREAKER
Learn more about “the Great 8” in the TekStream blog.
Issue 2: Search Performance
Next, let’s discuss search performance. When creating and crafting searches in Splunk, you want to make sure you give Splunk as much detail as possible about the data you are trying to search. There are four important fields that Splunk looks at to determine which data to bring back for you: index, sourcetype, source, and host. When running searches in Splunk, make sure to include the index or indexes where your data lives, provide the sourcetype or sourcetypes, your source or sources, which is the file path for your data, and finally the host or hosts that are sending the data into Splunk.
When creating a search where you want to get statistical information to show, before you do your calculating commands, make sure you filter the data to exactly what you are looking for. When filtering, avoid or limit using the NOT command. Try to tell Splunk what you are looking to include instead of trying to tell it what to exclude. Now, there is always the scenario where the number of what you want to include is very large. In cases like that, you can create a macro to include everything that we want to have Splunk search on, use a lookup to include all the values, or limit the number of NOTs that are used. Filtering your data to exactly what you are looking for is crucial with Splunk, as it allows Splunk to return more precise results in a quicker fashion. If there is a certain field or fields that you want to show in your search, but when you search the data a large number of fields get returned, use the fields command to tell Splunk which fields you want to bring back, so it does not bring back every single field. If you are able to limit the number of fields that Splunk brings back, it will improve the search performance.
Search performance also includes scheduled searches, reports, and alerts. You want to make sure you do not have too many scheduled searches with the same cron schedule or scheduled time. If you have more searches than cores on your Search Head running at one time, that means that all of your SH cores are being used up. This could cause scheduled searches to be delayed or skipped and could also delay some ad hoc searches from running.
Issue 3: High Resource Usage
High resource usage is the final topic I wanted to discuss. There are a large number of factors that play into how well our Splunk servers are performing. If you are noticing performance issues with your Splunk servers, make sure your boxes are up to Splunk’s best practice recommendations. How well your searches are performing can also determine how well your boxes are performing. If you are running bad searches, you will notice that the CPU and memory usage of your Splunk indexers and Search Heads will increase.
One way to check the resource usage of your Splunk boxes is to use the Monitoring Console -> Resource Usage -> Resource Usage: Instance. On this dashboard, you are able to see how much CPU and memory each of your Splunk boxes are using. I have provided a screenshot of part of this dashboard below:
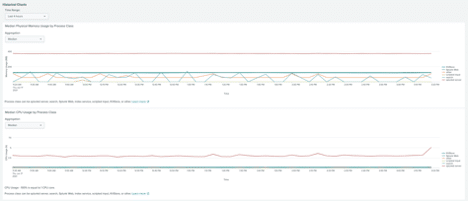
Another factor that plays into high CPU and memory usage could be the use of Python scripts on your Splunk boxes. There are many Splunk Technical Add-ons that have Python scripts embedded in the app. If you are experiencing high CPU and memory usage, you may want to check on your server to see what processes are using up the most CPU and memory.
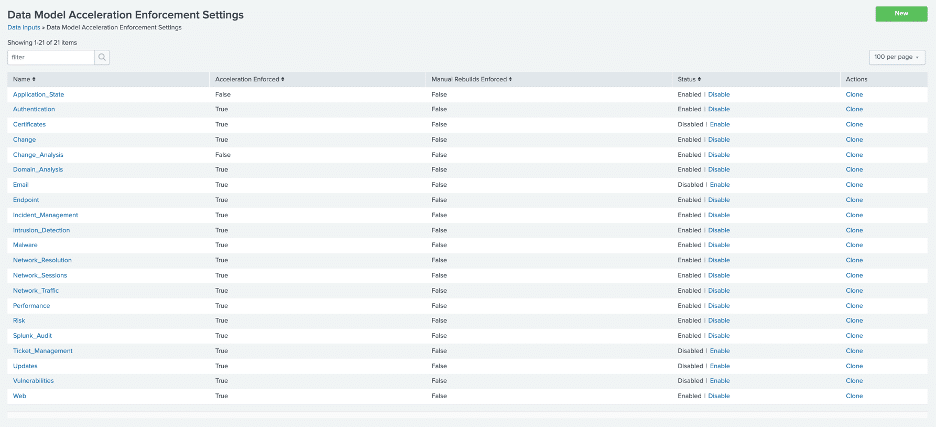
Recently I have been experiencing very high CPU and memory usage due to Splunk Accelerated Data Models. If you are using Accelerated Data Models, make sure that the ones you want are the only ones that are accelerated. If you have DMAs accelerated that are not being used, it will still go through the process of running to try and complete the data model and will still use up CPU and memory. A huge tip I have for those running Enterprise Security or simply using the DMAs: disable and unaccelerate the DMAs you are not using. To permanently disable DMAs, follow the instructions below:
Settings -> Data Inputs -> Data Model Acceleration Enforcement
Want to learn more about solving common Splunk issues? Contact us today!