
Using the ITSI_Summary Index and Pseudo Entities to Show Overall Health Scores
By: Brent McKinney | Splunk Consultant
In Splunk ITSI, you may come across times where you want to create an overall health service and need health scores from services that belong to private ITSI teams. However, once a service in ITSI belongs to a private team, it can no longer act as a dependency to a service outside its team. In these situations, you may need to manually pull health scores from the ITSI summary index as KPIs. In this blog, we will walk through a use case where we do exactly that, as well as use ITSI service names as pseudo entities to feed these KPIs. The goal here is for ITSI administrators to manually create these dependencies using the itsi_summary index, while still restricting private teams’ access to only their services.
Use Case: Say we have 20 various applications in our environment, and we have an independent ITSI service analyzer built for each. Each application service analyzer belongs to its own private ITSI team, has a number of child services and KPIs attached, and lives in one of three AWS regions: East, West, or Central. We want to create an overall health service analyzer that solely represents the overall health of each region and the applications within it. The challenge here is that because the application services in ITSI are in private teams, we can’t simply add them as dependencies to the overall health service. We will walk through how we can use the itsi_summary index, along with pseudo entities, to achieve the same results.
In an end state, we want to build the following Service Analyzer, with each region containing its applications as pseudo entities:
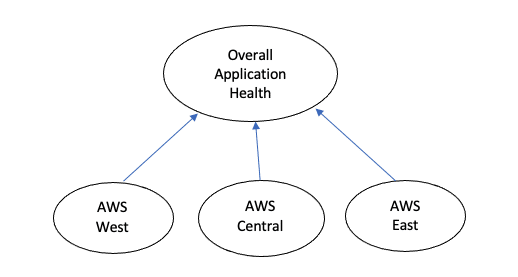
The “Overall Application Health” service will have no KPIs and simply depend on the region child services for its health score. So to begin, we can create the above four services in ITSI, and add the region services’ overall health scores as dependencies to the “Overall Application Health” service. Each region service will have one KPI, “Overall Health,” and the entities will be made up of the applications within that region.
Now, we will begin defining this “Overall Health” KPI using a search. For this, we will need to know the health score of each application and to which region it belongs. Our goal here is as follows: Create a KPI search that pulls the overall health score of each Application, and filter each application based on region. We can achieve this by utilizing the itsi_summary index and prebuilt macros.
Note: The itsi_summary index uses ONLY service IDs to get information on a particular service, so we’ll need to use the service_kpi_list macro to get the actual service names. This macro contains a lookup that has both the service name and ID, and will allow us to correlate and more intuitively define and filter our applications in the itsi_summary index.
index=itsi_summary

| join itsi_service_id

[| `service_kpi_list`

| search service_name = *east AND service_name=*Overall Health

| rename serviceid as itsi_service_id

]

| rename alert_value as health_score

| table health_score service_name
The above SPL will be used for our KPI searches and contains a sub-search. The inner search, which is run first, uses a macro to pull back a list of each service in the environment, both name and ID, along with the KPIs within each. From here, we filter to bring back the appropriate overall health score of our application and region it belongs to. (Note: This filter may differ depending on the naming convention of your services. The above is an example to filter health scores for the east region service.) We will have a unique KPI search for each region, so our goal here is to filter by region, and only grab the overall health KPI for each application. Once we have the applications we want, we can join this with the itsi_summary index in the outer search to obtain the actual health scores of those applications we returned in the inner search. In short, the inner search gives us the names of the applications we want, and the outer search correlates them to their health scores.
Now that we’re pulling back the health scores that we need, we can define what the threshold field should be, how to split the threshold fields by application, and how to aggregate the threshold field overall. In our example, the threshold field should be “health_score.” Because the application names may not be direct data sources in your environment, but rather the names of services, we can simply define them as we did in the KPI search above, rather than import them in ITSI. Entities defined this way are referred to as “pseudo entitles,” since they exist in the KPI search but not definitively in ITSI. For this, we will choose “service_name” for “Entity Split by field.” This allows us to split and monitor the applications contributing to each region without having to manage the entities themselves in ITSI.
For calculation, we want the latest of “health_score” as entity value and the Average of entity value as aggregate. This says that for each application, take the latest recorded health score, and for the overall health of the region, take the average of all health scores.
We will repeat these steps for each region, editing our SPL to filter accordingly. Once these services are saved and enabled, we can see how each region is performing and contributing to the overall health of our environment, and how each application is contributing to the health of each region! This approach allows us to have applications built out in private teams in ITSI, while still allowing us to have a service that shows us ALL of the applications’ overall health scores.
Want to learn more about the ITSI Summary and how it relates to Overall Health Scores? Contact us today!