
Application Module Pool Statistics Explained

Optimizing ‘Application Module’ pools are second to none, when you tune ADF Business Components (ADF BC) application for performance bottlenecks or out of memory errors. To analyze performance problems effectively, it is essential to have metrics.
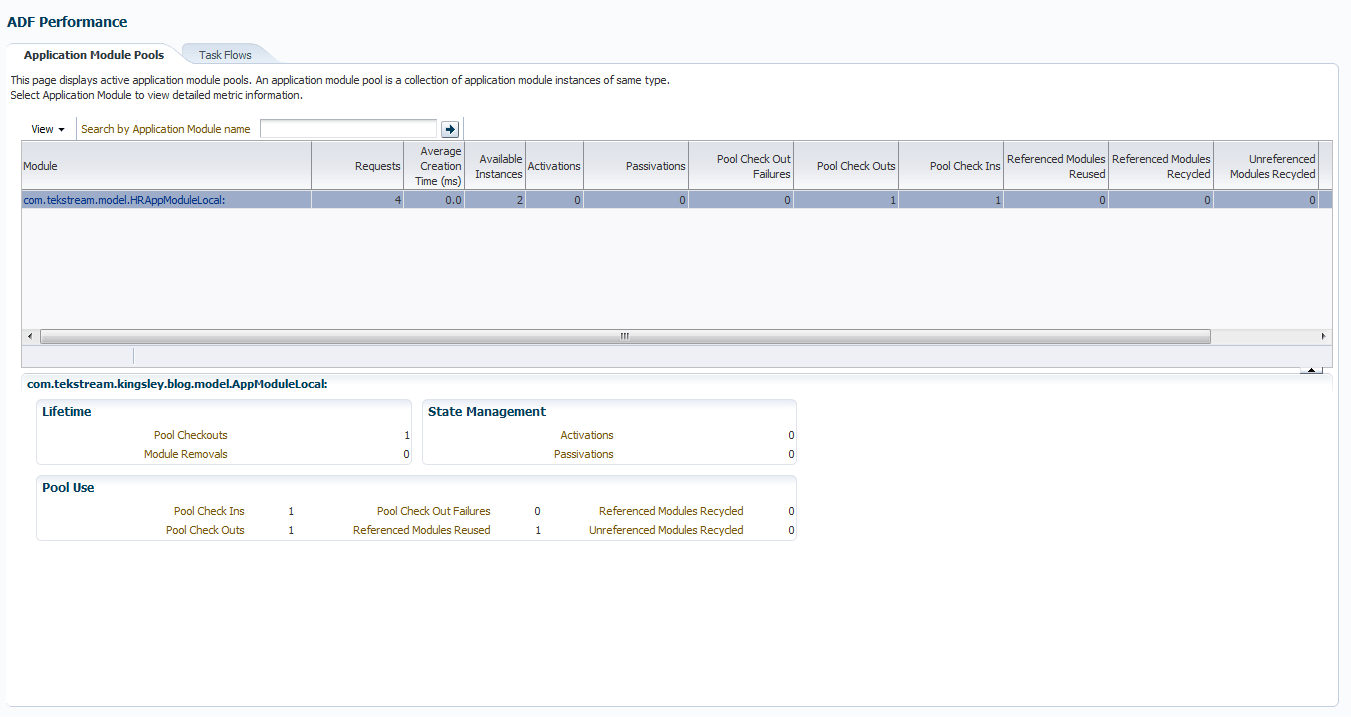
You can view Application Module pool metrics via Enterprise Manger:
- From Application Deployments, click the desired application
- From the Application Deployment menu, choose ADF > ADF Performance.
- Click the Application Module Pools tab
Alternatively, You can view Application Module pool metrics via DMS Spy:
- Navigate to the URL http://host:port/dms/Spy
- Authenticate yourself as administer on the login screen.
- On the left side ‘Metrics Tables’ click on ‘ampool’, after successful log on.
Dynamic Monitoring Service (DMS) enables us to measure application specific performance information, either through the Spy Servlet or through exposed MBeans. The DMS metrics can make your job bit easier to set optimal AM Pool configuration.
Although the DMS metrics are always available, the interpretations of them are somewhat obscure. Unless you know what type of sensor is used to collect the metrics, it is difficult to interpret the metrics. For example, It may be confusing to anyone, to see instancecount value is below instanceCheckedIn value or instanceCheckedOutFailed value; Or like how to interpret maxActive value on appModuleCreationTime metrics. In this blog, I try to provide possible interpretation to each ‘ampool’ metrics with little bit of detail about each sensor.
DMS Sensors enable DMS to define and collect a set of metrics. DMS has three different kinds of sensors:
DMS PhaseEvent Sensor
This sensor particularly helps to measure the time spent between block of code (shown with the metric name ‘time’). Also, optionally it provides other/derived performance metrics like minimum time, maximum time, average time spent.
appModuleCreationTime metrics measures the time taken to create a new pool resource (AM).
time – The total number of milliseconds spent on creating pool resources.
completed – The number denotes the occurrence of pool resource creation event.
avg – Average number of time in milliseconds to create a new pool resource.
maxTime – Records the longest time it took to create a pool resource, since the creation of the pool.
minTime – Records the shortest time it took to create a pool resource, since the creation of the pool.
active – Specifies the number of threads performing pool resource creation activity, at the time when the DMS statistics are gathered.
maxActive – specifies the maximum number of concurrent threads involved in the pool resource creation phase, since the pool started.
DMS State Sensor
Use this sensor, if you are interested in tracking the state of the system or in need of metrics which is not associated with an event. For example, you could want to see how many number of active users involved in particular instance and so on. This sensor optionally provides other/derived performance metrics like count, maxValue, minValue.
availableInstanceCount – number of available AM instance
value – Represents number of available AM instance, when the latest DMS statistics is gathered.
count – Specifies number of times the value got updated.
maxValue – Shows the maximum number of available AM instance since startup.
minValue – Shows the minimum number of available AM instance since the pool start.
instanceConnected – Number of AM instance that are currently registered with the pool.
For the sake of brevity, I leave up to you to deduce meaning of each metrics values associated with this sensor and the next one, like the previous one.
instanceCount – Number of connected AM instance.
Event Sensor
This acts as a counter and gets you the number of times the event occurred since the process started. When you interpret below metric values related to AM pool, always aware that, the values are not for particular instance/time period, but since the pool lifetime/the pool started.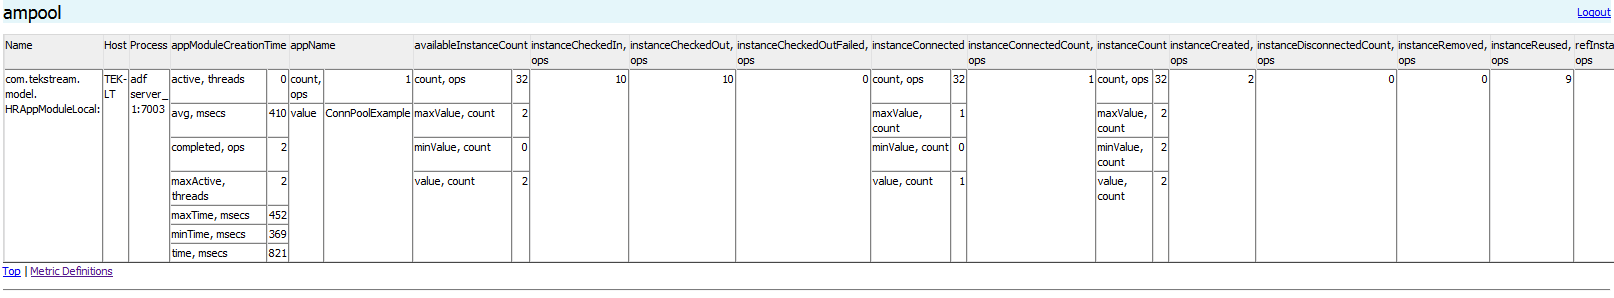
instanceCheckedIn – Number of times Application modules checked in the pool
instanceCheckedOut – Number of times Application modules checked out of the pool
instanceCheckedOutFailed – Count indicates the number of failures occurred while checking out the item
instanceConnectedCount – Number of Application module instances referenced by the application, since the pool lifetime
instanceCreated – Number of AM module instance created since the lifetime of the pool
instanceDisconnectedCount – Number of Application module instances disconnected, since the pool lifetime
instanceRemoved – Number of AM module instance removed from the pool since the lifetime of the pool
instanceReused – Number of times AM module instance reused since the lifetime of the pool
refInstanceRecycled – Number of times reference instance recycled
stateActivated – Number of times activation has occurred
statePassivated – Number of times Passivation has occurred
unrefInstanceRecycled – Number of unreferenced Instance recycled
Still have questions? That’s what we’re here for. Send us your information and we’ll have a technical expert contact you to discuss your challenges and how to solve them.